
|
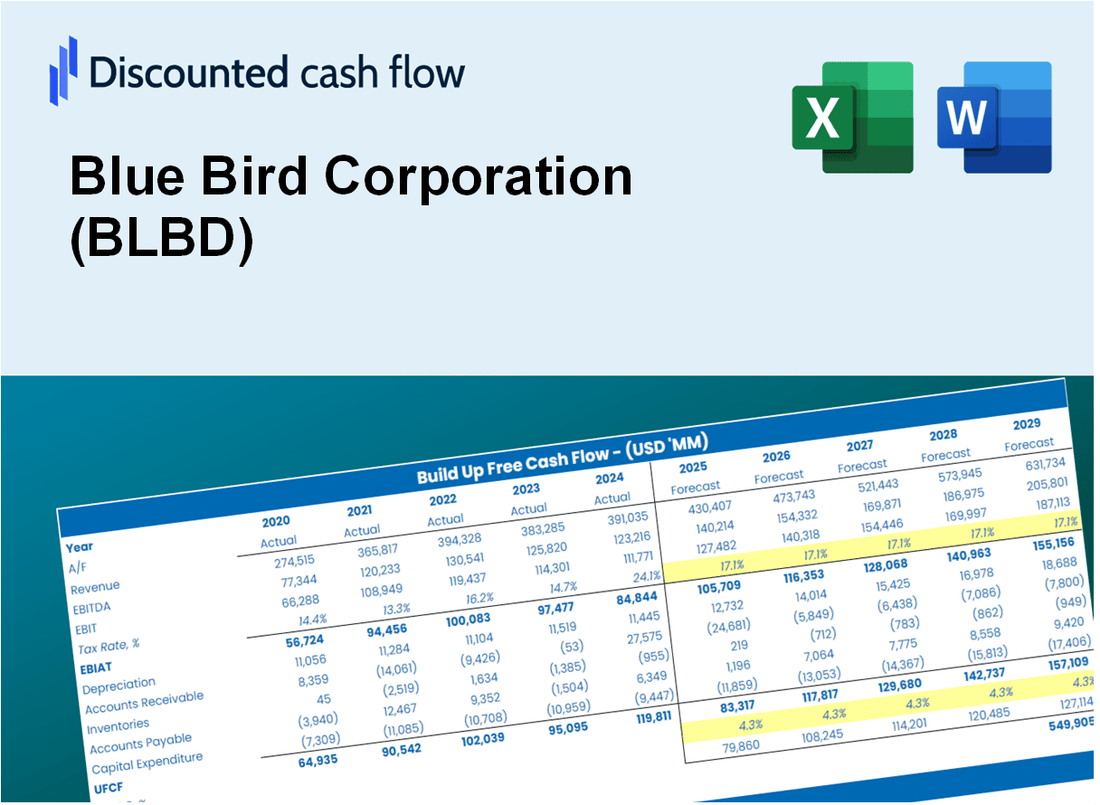
DCF -Bewertung der Blue Bird Corporation (BLBD) |
Fully Editable: Tailor To Your Needs In Excel Or Sheets
Professional Design: Trusted, Industry-Standard Templates
Investor-Approved Valuation Models
MAC/PC Compatible, Fully Unlocked
No Expertise Is Needed; Easy To Follow
Blue Bird Corporation (BLBD) Bundle
Als Investor oder Analyst ist der DCF-Taschenrechner der Blue Bird Corporation (BLBD) Ihre Anlaufstelle für eine genaue Bewertung. Ausgestattet mit echten Daten der Blue Bird Corporation können Sie problemlos Prognosen anpassen und die Auswirkungen sofort beobachten.
Discounted Cash Flow (DCF) - (USD MM)
| Year | AY1 2020 |
AY2 2021 |
AY3 2022 |
AY4 2023 |
AY5 2024 |
FY1 2025 |
FY2 2026 |
FY3 2027 |
FY4 2028 |
FY5 2029 |
|---|---|---|---|---|---|---|---|---|---|---|
| Revenue | 879.2 | 684.0 | 800.6 | 1,132.8 | 1,347.2 | 1,533.3 | 1,745.1 | 1,986.1 | 2,260.5 | 2,572.8 |
| Revenue Growth, % | 0 | -22.2 | 17.05 | 41.49 | 18.92 | 13.81 | 13.81 | 13.81 | 13.81 | 13.81 |
| EBITDA | 37.1 | 22.0 | -23.2 | 60.9 | 152.3 | 65.1 | 74.1 | 84.3 | 95.9 | 109.2 |
| EBITDA, % | 4.22 | 3.21 | -2.9 | 5.38 | 11.31 | 4.24 | 4.24 | 4.24 | 4.24 | 4.24 |
| Depreciation | 14.4 | 14.2 | 15.2 | 17.1 | 14.8 | 25.2 | 28.7 | 32.7 | 37.2 | 42.3 |
| Depreciation, % | 1.64 | 2.08 | 1.89 | 1.51 | 1.1 | 1.64 | 1.64 | 1.64 | 1.64 | 1.64 |
| EBIT | 22.7 | 7.7 | -38.4 | 43.8 | 137.5 | 39.9 | 45.4 | 51.6 | 58.8 | 66.9 |
| EBIT, % | 2.59 | 1.13 | -4.79 | 3.87 | 10.21 | 2.6 | 2.6 | 2.6 | 2.6 | 2.6 |
| Total Cash | 44.5 | 11.7 | 10.5 | 79.0 | 127.7 | 75.2 | 85.6 | 97.5 | 110.9 | 126.2 |
| Total Cash, percent | .0 | .0 | .0 | .0 | .0 | .0 | .0 | .0 | .0 | .0 |
| Account Receivables | 7.6 | 10.0 | 12.5 | 12.6 | 59.1 | 28.8 | 32.8 | 37.3 | 42.4 | 48.3 |
| Account Receivables, % | 0.86702 | 1.46 | 1.57 | 1.11 | 4.39 | 1.88 | 1.88 | 1.88 | 1.88 | 1.88 |
| Inventories | 56.5 | 125.2 | 143.0 | 135.3 | 127.8 | 196.3 | 223.4 | 254.3 | 289.4 | 329.4 |
| Inventories, % | 6.43 | 18.31 | 17.86 | 11.94 | 9.49 | 12.8 | 12.8 | 12.8 | 12.8 | 12.8 |
| Accounts Payable | 57.6 | 72.3 | 107.9 | 137.1 | 143.2 | 163.5 | 186.1 | 211.8 | 241.1 | 274.4 |
| Accounts Payable, % | 6.55 | 10.57 | 13.48 | 12.11 | 10.63 | 10.67 | 10.67 | 10.67 | 10.67 | 10.67 |
| Capital Expenditure | -19.0 | -12.2 | -6.5 | -8.5 | -15.3 | -20.3 | -23.2 | -26.4 | -30.0 | -34.1 |
| Capital Expenditure, % | -2.16 | -1.79 | -0.80598 | -0.75212 | -1.13 | -1.33 | -1.33 | -1.33 | -1.33 | -1.33 |
| Tax Rate, % | 16.85 | 16.85 | 16.85 | 16.85 | 16.85 | 16.85 | 16.85 | 16.85 | 16.85 | 16.85 |
| EBITAT | 19.5 | 3.1 | -30.1 | 31.8 | 114.3 | 28.7 | 32.6 | 37.1 | 42.3 | 48.1 |
| Depreciation | ||||||||||
| Changes in Account Receivables | ||||||||||
| Changes in Inventories | ||||||||||
| Changes in Accounts Payable | ||||||||||
| Capital Expenditure | ||||||||||
| UFCF | 8.3 | -51.3 | -6.1 | 77.3 | 80.9 | 15.7 | 29.7 | 33.8 | 38.4 | 43.7 |
| WACC, % | 10.39 | 10.12 | 10.35 | 10.31 | 10.37 | 10.31 | 10.31 | 10.31 | 10.31 | 10.31 |
| PV UFCF | ||||||||||
| SUM PV UFCF | 116.5 | |||||||||
| Long Term Growth Rate, % | 2.00 | |||||||||
| Free cash flow (T + 1) | 45 | |||||||||
| Terminal Value | 537 | |||||||||
| Present Terminal Value | 329 | |||||||||
| Enterprise Value | 445 | |||||||||
| Net Debt | -32 | |||||||||
| Equity Value | 477 | |||||||||
| Diluted Shares Outstanding, MM | 33 | |||||||||
| Equity Value Per Share | 14.30 |
What You Will Get
- Comprehensive BLBD Financials: Access to historical and projected data for precise valuation.
- Customizable Inputs: Adjust WACC, tax rates, revenue growth, and capital expenditures as needed.
- Real-Time Calculations: Intrinsic value and NPV are updated automatically.
- Scenario Analysis: Evaluate various scenarios to assess Blue Bird Corporation’s future performance.
- User-Friendly Design: Designed for professionals while remaining approachable for newcomers.
Key Features
- Comprehensive Financial Data: Gain access to precise historical data and future forecasts for Blue Bird Corporation (BLBD).
- Tailored Forecast Inputs: Modify the highlighted fields such as WACC, growth rates, and profit margins to suit your analysis.
- Real-Time Calculations: Automatic recalculations for DCF, Net Present Value (NPV), and cash flow projections.
- User-Friendly Dashboard: Intuitive charts and summaries to help you interpret your valuation findings easily.
- Designed for All Skill Levels: An accessible layout ideal for investors, CFOs, and consultants alike.
How It Works
- Step 1: Download the prebuilt Excel template featuring Blue Bird Corporation’s (BLBD) data.
- Step 2: Navigate through the pre-filled sheets to grasp the essential metrics.
- Step 3: Modify forecasts and assumptions in the editable yellow cells (WACC, growth, margins).
- Step 4: Instantly see the recalculated results, including Blue Bird Corporation’s intrinsic value.
- Step 5: Utilize the outputs to make informed investment decisions or create detailed reports.
Why Choose This Calculator for Blue Bird Corporation (BLBD)?
- Precise Financial Insights: Utilizes actual Blue Bird Corporation financials for trustworthy valuation outcomes.
- Tailorable Features: Modify essential factors such as growth rates, WACC, and tax rates to align with your forecasts.
- Efficiency Boost: Ready-made calculations save you the hassle of starting from the beginning.
- Expert-Level Resource: Crafted for investors, analysts, and consultants focused on Blue Bird Corporation.
- Easy to Navigate: User-friendly design and clear, step-by-step guidance facilitate use for everyone.
Who Should Use This Product?
- Investors: Accurately assess Blue Bird Corporation’s (BLBD) fair value prior to making investment choices.
- CFOs: Utilize a professional-grade DCF model for comprehensive financial reporting and analysis.
- Consultants: Efficiently modify the template for valuation reports tailored to clients.
- Entrepreneurs: Acquire insights into financial modeling practices employed by leading companies.
- Educators: Employ it as a teaching resource to illustrate valuation techniques.
What the Template Contains
- Pre-Filled DCF Model: Blue Bird Corporation’s (BLBD) financial data preloaded for immediate use.
- WACC Calculator: Detailed calculations for Weighted Average Cost of Capital.
- Financial Ratios: Evaluate Blue Bird Corporation’s (BLBD) profitability, leverage, and efficiency.
- Editable Inputs: Change assumptions such as growth, margins, and CAPEX to fit your scenarios.
- Financial Statements: Annual and quarterly reports to support detailed analysis.
- Interactive Dashboard: Easily visualize key valuation metrics and results.
Disclaimer
All information, articles, and product details provided on this website are for general informational and educational purposes only. We do not claim any ownership over, nor do we intend to infringe upon, any trademarks, copyrights, logos, brand names, or other intellectual property mentioned or depicted on this site. Such intellectual property remains the property of its respective owners, and any references here are made solely for identification or informational purposes, without implying any affiliation, endorsement, or partnership.
We make no representations or warranties, express or implied, regarding the accuracy, completeness, or suitability of any content or products presented. Nothing on this website should be construed as legal, tax, investment, financial, medical, or other professional advice. In addition, no part of this site—including articles or product references—constitutes a solicitation, recommendation, endorsement, advertisement, or offer to buy or sell any securities, franchises, or other financial instruments, particularly in jurisdictions where such activity would be unlawful.
All content is of a general nature and may not address the specific circumstances of any individual or entity. It is not a substitute for professional advice or services. Any actions you take based on the information provided here are strictly at your own risk. You accept full responsibility for any decisions or outcomes arising from your use of this website and agree to release us from any liability in connection with your use of, or reliance upon, the content or products found herein.