
|
Blend Labs, Inc. (BLND) DCF -Bewertung |
Fully Editable: Tailor To Your Needs In Excel Or Sheets
Professional Design: Trusted, Industry-Standard Templates
Investor-Approved Valuation Models
MAC/PC Compatible, Fully Unlocked
No Expertise Is Needed; Easy To Follow
Blend Labs, Inc. (BLND) Bundle
Stürzen Sie Ihre Analyse und verbessern Sie die Präzision mit unserem DCF -Taschenrechner für Blend Labs, Inc. (BLND)! Mithilfe aktueller Blend-Labs-Daten und anpassbaren Annahmen ermöglicht dieses Tool die Prognose, Bewertung und Bewertung von Mischlabors wie einem professionellen Investor.
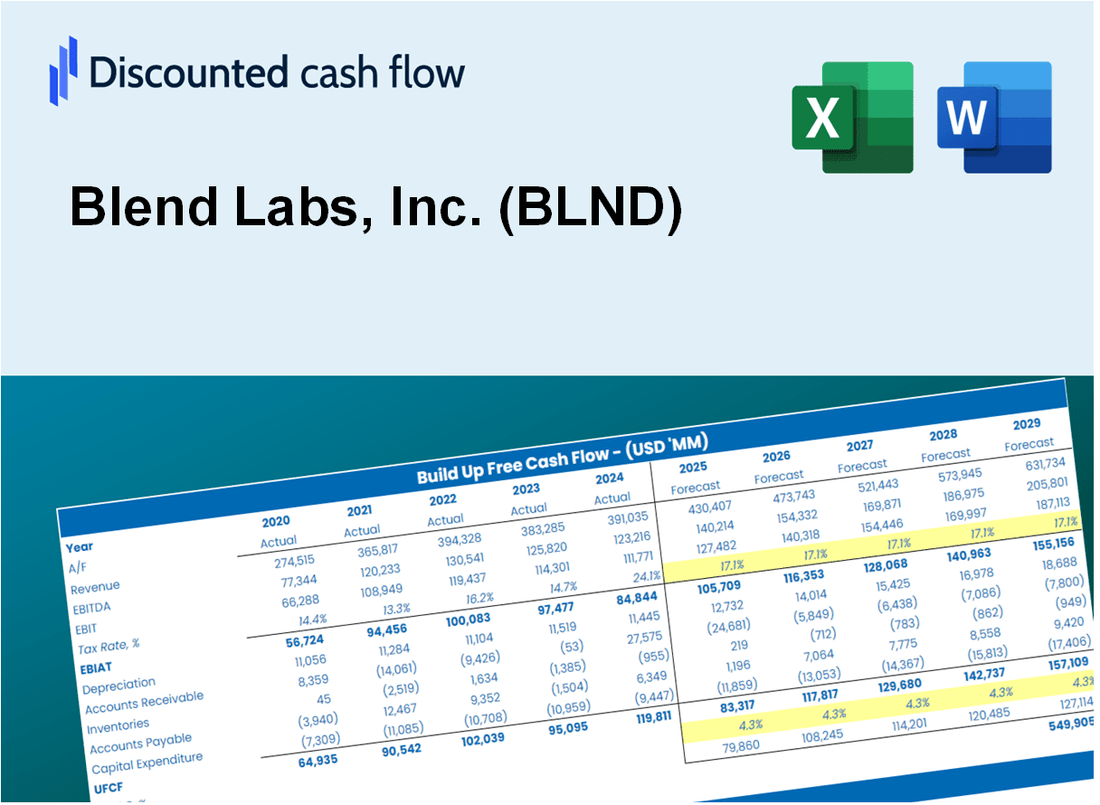
Discounted Cash Flow (DCF) - (USD MM)
| Year | AY1 2020 |
AY2 2021 |
AY3 2022 |
AY4 2023 |
AY5 2024 |
FY1 2025 |
FY2 2026 |
FY3 2027 |
FY4 2028 |
FY5 2029 |
|---|---|---|---|---|---|---|---|---|---|---|
| Revenue | 96.0 | 234.5 | 235.2 | 156.8 | 162.0 | 190.5 | 224.0 | 263.3 | 309.6 | 364.0 |
| Revenue Growth, % | 0 | 144.19 | 0.30107 | -33.31 | 3.3 | 17.57 | 17.57 | 17.57 | 17.57 | 17.57 |
| EBITDA | -68.2 | -182.9 | -726.8 | -143.2 | -49.6 | -141.3 | -166.2 | -195.4 | -229.7 | -270.1 |
| EBITDA, % | -71.07 | -78.01 | -309.03 | -91.31 | -30.63 | -74.2 | -74.2 | -74.2 | -74.2 | -74.2 |
| Depreciation | 6.3 | 13.8 | 14.4 | 5.8 | .4 | 8.6 | 10.1 | 11.9 | 14.0 | 16.4 |
| Depreciation, % | 6.61 | 5.89 | 6.13 | 3.67 | 0.26972 | 4.51 | 4.51 | 4.51 | 4.51 | 4.51 |
| EBIT | -74.6 | -196.7 | -741.3 | -149.0 | -50.1 | -147.6 | -173.5 | -204.0 | -239.9 | -282.0 |
| EBIT, % | -77.68 | -83.9 | -315.16 | -94.98 | -30.9 | -77.49 | -77.49 | -77.49 | -77.49 | -77.49 |
| Total Cash | 151.7 | 547.2 | 354.1 | 136.9 | 98.5 | 170.7 | 200.7 | 236.0 | 277.4 | 326.2 |
| Total Cash, percent | .0 | .0 | .0 | .0 | .0 | .0 | .0 | .0 | .0 | .0 |
| Account Receivables | 24.2 | 39.4 | 24.0 | 19.9 | 19.9 | 29.4 | 34.6 | 40.7 | 47.8 | 56.2 |
| Account Receivables, % | 25.22 | 16.82 | 10.19 | 12.71 | 12.28 | 15.44 | 15.44 | 15.44 | 15.44 | 15.44 |
| Inventories | .0 | .0 | .0 | .0 | .0 | .0 | .0 | .0 | .0 | .0 |
| Inventories, % | 0 | 0 | 0 | 0 | 0 | 0 | 0 | 0 | 0 | 0 |
| Accounts Payable | 3.4 | 6.2 | 1.3 | 2.2 | 2.4 | 3.7 | 4.3 | 5.1 | 6.0 | 7.0 |
| Accounts Payable, % | 3.58 | 2.63 | 0.53571 | 1.38 | 1.49 | 1.92 | 1.92 | 1.92 | 1.92 | 1.92 |
| Capital Expenditure | -1.3 | -1.9 | -2.1 | -.6 | -9.8 | -3.6 | -4.3 | -5.0 | -5.9 | -6.9 |
| Capital Expenditure, % | -1.38 | -0.80428 | -0.87925 | -0.37425 | -6.08 | -1.9 | -1.9 | -1.9 | -1.9 | -1.9 |
| Tax Rate, % | -14.53 | -14.53 | -14.53 | -14.53 | -14.53 | -14.53 | -14.53 | -14.53 | -14.53 | -14.53 |
| EBITAT | -74.6 | -162.1 | -743.7 | -153.6 | -57.3 | -142.4 | -167.4 | -196.8 | -231.4 | -272.1 |
| Depreciation | ||||||||||
| Changes in Account Receivables | ||||||||||
| Changes in Inventories | ||||||||||
| Changes in Accounts Payable | ||||||||||
| Capital Expenditure | ||||||||||
| UFCF | -90.4 | -162.6 | -720.8 | -143.4 | -66.5 | -145.7 | -166.1 | -195.3 | -229.6 | -269.9 |
| WACC, % | 10.24 | 10.1 | 10.24 | 10.24 | 10.24 | 10.21 | 10.21 | 10.21 | 10.21 | 10.21 |
| PV UFCF | ||||||||||
| SUM PV UFCF | -736.5 | |||||||||
| Long Term Growth Rate, % | 2.00 | |||||||||
| Free cash flow (T + 1) | -275 | |||||||||
| Terminal Value | -3,353 | |||||||||
| Present Terminal Value | -2,062 | |||||||||
| Enterprise Value | -2,799 | |||||||||
| Net Debt | -38 | |||||||||
| Equity Value | -2,760 | |||||||||
| Diluted Shares Outstanding, MM | 254 | |||||||||
| Equity Value Per Share | -10.87 |
What You Will Get
- Editable Excel Template: A fully customizable Excel-based DCF Calculator featuring pre-filled financial data for Blend Labs, Inc. (BLND).
- Real-World Data: Access to historical data and forward-looking estimates (highlighted in the yellow cells).
- Forecast Flexibility: Adjust forecast assumptions such as revenue growth, EBITDA %, and WACC.
- Automatic Calculations: Instantly observe how your inputs affect the valuation of Blend Labs, Inc. (BLND).
- Professional Tool: Designed for investors, CFOs, consultants, and financial analysts.
- User-Friendly Design: Organized for clarity and ease of use, complete with step-by-step instructions.
Key Features
- Pre-Loaded Data: Blend Labs’ historical financial statements and pre-filled forecasts.
- Fully Adjustable Inputs: Modify WACC, tax rates, revenue growth, and EBITDA margins.
- Instant Results: Observe Blend Labs’ intrinsic value recalculating in real time.
- Clear Visual Outputs: Dashboard charts showcase valuation results and key metrics.
- Built for Accuracy: A professional tool designed for analysts, investors, and finance experts.
How It Works
- Download: Obtain the pre-formatted Excel file containing Blend Labs, Inc.'s (BLND) financial data.
- Customize: Modify projections, including revenue growth, EBITDA %, and WACC as needed.
- Update Automatically: The intrinsic value and NPV calculations refresh in real-time.
- Test Scenarios: Develop various projections and instantly evaluate different outcomes.
- Make Decisions: Leverage the valuation insights to inform your investment strategy.
Why Choose Blend Labs, Inc. (BLND)?
- Streamlined Processes: Simplify your workflow with our user-friendly tools and resources.
- Enhanced Precision: Our innovative technology ensures accurate data analysis and reporting.
- Fully Adaptable: Customize our solutions to meet your unique business needs and objectives.
- User-Friendly Interface: Intuitive design allows for easy navigation and quick insights.
- Endorsed by Industry Leaders: Trusted by top professionals for our commitment to quality and performance.
Who Should Use Blend Labs, Inc. (BLND)?
- Investors: Enhance your investment strategies with advanced analytics and insights from Blend Labs.
- Financial Analysts: Streamline your analysis process with Blend's intuitive data visualization tools.
- Consultants: Easily customize Blend's solutions for impactful client presentations and strategic reports.
- Tech Enthusiasts: Explore innovative financial technology solutions that drive efficiency and accuracy.
- Educators and Students: Utilize Blend Labs as a resource for hands-on learning in fintech and analytics courses.
What the Template Contains
- Historical Data: Includes Blend Labs’ past financials and baseline forecasts.
- DCF and Levered DCF Models: Detailed templates to calculate Blend Labs’ intrinsic value.
- WACC Sheet: Pre-built calculations for Weighted Average Cost of Capital.
- Editable Inputs: Modify key drivers like growth rates, EBITDA %, and CAPEX assumptions.
- Quarterly and Annual Statements: A complete breakdown of Blend Labs’ financials.
- Interactive Dashboard: Visualize valuation results and projections dynamically.
Disclaimer
All information, articles, and product details provided on this website are for general informational and educational purposes only. We do not claim any ownership over, nor do we intend to infringe upon, any trademarks, copyrights, logos, brand names, or other intellectual property mentioned or depicted on this site. Such intellectual property remains the property of its respective owners, and any references here are made solely for identification or informational purposes, without implying any affiliation, endorsement, or partnership.
We make no representations or warranties, express or implied, regarding the accuracy, completeness, or suitability of any content or products presented. Nothing on this website should be construed as legal, tax, investment, financial, medical, or other professional advice. In addition, no part of this site—including articles or product references—constitutes a solicitation, recommendation, endorsement, advertisement, or offer to buy or sell any securities, franchises, or other financial instruments, particularly in jurisdictions where such activity would be unlawful.
All content is of a general nature and may not address the specific circumstances of any individual or entity. It is not a substitute for professional advice or services. Any actions you take based on the information provided here are strictly at your own risk. You accept full responsibility for any decisions or outcomes arising from your use of this website and agree to release us from any liability in connection with your use of, or reliance upon, the content or products found herein.