
|
Biontech SE (BNTX) DCF -Bewertung |
Fully Editable: Tailor To Your Needs In Excel Or Sheets
Professional Design: Trusted, Industry-Standard Templates
Investor-Approved Valuation Models
MAC/PC Compatible, Fully Unlocked
No Expertise Is Needed; Easy To Follow
BioNTech SE (BNTX) Bundle
Vereinfachen Sie die Bewertung der Biontech SE (BNTX) mit diesem anpassbaren DCF -Taschenrechner! Mit den tatsächlichen Biontech SE (BNTX) -Fonds und einstellbaren Prognoseeingaben können Sie Szenarien testen und Biontech SE (BNTX) in nur Minuten aufzeigen.
What You Will Get
- Editable Excel Template: A fully customizable Excel-based DCF Calculator featuring pre-filled real BNTX financials.
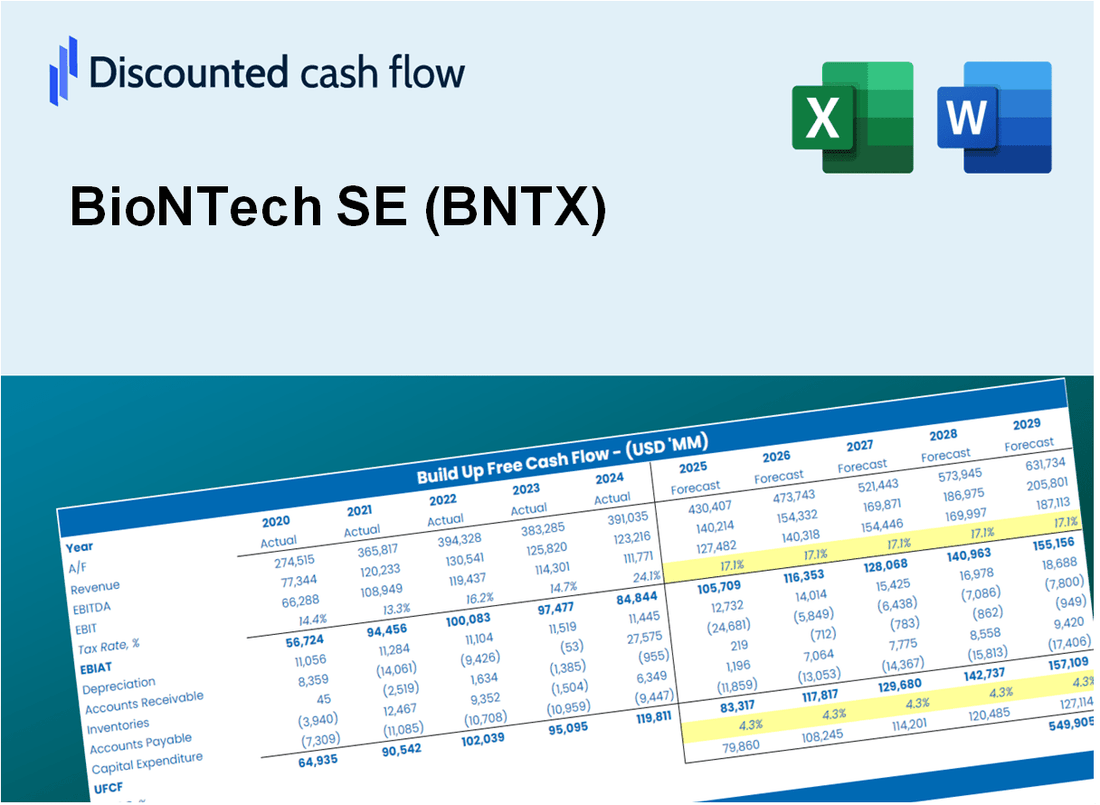
- Real-World Data: Historical data and forward-looking estimates (as indicated in the yellow cells).
- Forecast Flexibility: Adjust forecast assumptions such as revenue growth, EBITDA %, and WACC.
- Automatic Calculations: Instantly observe the effect of your inputs on BioNTech’s valuation.
- Professional Tool: Designed for investors, CFOs, consultants, and financial analysts.
- User-Friendly Design: Organized for clarity and ease of use, complete with step-by-step instructions.
Key Features
- Pre-Loaded Data: BioNTech SE’s historical financial statements and pre-filled forecasts.
- Fully Adjustable Inputs: Modify WACC, tax rates, revenue growth, and EBITDA margins.
- Instant Results: Watch BioNTech SE’s intrinsic value recalculate in real time.
- Clear Visual Outputs: Dashboard charts showcase valuation results and key metrics.
- Built for Accuracy: A professional tool tailored for analysts, investors, and finance experts.
How It Works
- Step 1: Download the prebuilt Excel template featuring BioNTech SE’s (BNTX) data.
- Step 2: Review the pre-filled sheets to familiarize yourself with the key metrics.
- Step 3: Modify forecasts and assumptions in the editable yellow cells (WACC, growth, margins).
- Step 4: Instantly see the recalculated results, including BioNTech SE’s (BNTX) intrinsic value.
- Step 5: Make well-informed investment decisions or create reports using the generated outputs.
Why Choose This Calculator for BioNTech SE (BNTX)?
- Tailored for Experts: A specialized tool designed for researchers, investors, and biotech analysts.
- Comprehensive Data: BioNTech’s historical and anticipated financials integrated for precision.
- Flexible Scenario Analysis: Effortlessly test various forecasts and assumptions.
- Detailed Outputs: Automatically computes intrinsic value, NPV, and essential metrics.
- User-Friendly: Step-by-step guidance ensures a smooth experience.
Who Should Use This Product?
- Biotechnology Students: Explore drug development processes and apply them using real-world data.
- Researchers: Integrate advanced models into studies or academic projects focused on mRNA technology.
- Investors: Validate your investment strategies and evaluate valuation metrics for BioNTech SE (BNTX).
- Financial Analysts: Enhance your analysis with a ready-to-use, customizable valuation model specifically for biotech firms.
- Healthcare Entrepreneurs: Understand how large biotech companies like BioNTech SE (BNTX) are assessed in the market.
What the Template Contains
- Comprehensive DCF Model: Editable template with detailed valuation calculations tailored for BioNTech SE (BNTX).
- Real-World Data: BioNTech’s historical and projected financials preloaded for thorough analysis.
- Customizable Parameters: Adjust WACC, growth rates, and tax assumptions to explore various scenarios.
- Financial Statements: Complete annual and quarterly breakdowns for enhanced insights.
- Key Ratios: Built-in analysis for profitability, efficiency, and leverage specific to BioNTech SE (BNTX).
- Dashboard with Visual Outputs: Charts and tables for clear, actionable results regarding BioNTech SE (BNTX).
Disclaimer
All information, articles, and product details provided on this website are for general informational and educational purposes only. We do not claim any ownership over, nor do we intend to infringe upon, any trademarks, copyrights, logos, brand names, or other intellectual property mentioned or depicted on this site. Such intellectual property remains the property of its respective owners, and any references here are made solely for identification or informational purposes, without implying any affiliation, endorsement, or partnership.
We make no representations or warranties, express or implied, regarding the accuracy, completeness, or suitability of any content or products presented. Nothing on this website should be construed as legal, tax, investment, financial, medical, or other professional advice. In addition, no part of this site—including articles or product references—constitutes a solicitation, recommendation, endorsement, advertisement, or offer to buy or sell any securities, franchises, or other financial instruments, particularly in jurisdictions where such activity would be unlawful.
All content is of a general nature and may not address the specific circumstances of any individual or entity. It is not a substitute for professional advice or services. Any actions you take based on the information provided here are strictly at your own risk. You accept full responsibility for any decisions or outcomes arising from your use of this website and agree to release us from any liability in connection with your use of, or reliance upon, the content or products found herein.