
|
Bunzl Plc (Bnzl.l) DCF -Bewertung |
Fully Editable: Tailor To Your Needs In Excel Or Sheets
Professional Design: Trusted, Industry-Standard Templates
Investor-Approved Valuation Models
MAC/PC Compatible, Fully Unlocked
No Expertise Is Needed; Easy To Follow
Bunzl plc (BNZL.L) Bundle
Optimieren Sie Ihre Zeit und verbessern Sie die Präzision mit unserem (Bnzll) DCF -Taschenrechner! Mithilfe realer Daten von Bunzl plc und anpassbaren Annahmen können Sie dieses Tool wie einen erfahrenen Investor prognostizieren, analysieren und bewerten.
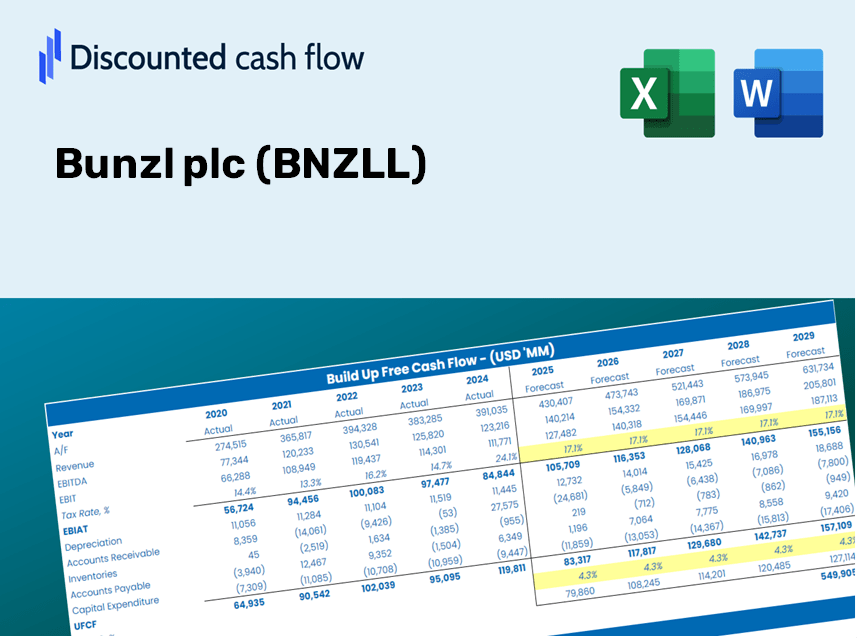
Discounted Cash Flow (DCF) - (USD MM)
| Year | AY1 2020 |
AY2 2021 |
AY3 2022 |
AY4 2023 |
AY5 2024 |
FY1 2025 |
FY2 2026 |
FY3 2027 |
FY4 2028 |
FY5 2029 |
|---|---|---|---|---|---|---|---|---|---|---|
| Revenue | 10,111.1 | 10,285.1 | 12,039.5 | 11,797.1 | 11,776.4 | 12,264.8 | 12,773.5 | 13,303.3 | 13,855.0 | 14,429.6 |
| Revenue Growth, % | 0 | 1.72 | 17.06 | -2.01 | -0.17547 | 4.15 | 4.15 | 4.15 | 4.15 | 4.15 |
| EBITDA | 896.2 | 909.0 | 1,033.9 | 1,179.3 | 1,220.8 | 1,144.4 | 1,191.8 | 1,241.3 | 1,292.7 | 1,346.3 |
| EBITDA, % | 8.86 | 8.84 | 8.59 | 10 | 10.37 | 9.33 | 9.33 | 9.33 | 9.33 | 9.33 |
| Depreciation | 272.1 | 277.7 | 317.9 | 342.8 | 384.1 | 348.3 | 362.7 | 377.8 | 393.5 | 409.8 |
| Depreciation, % | 2.69 | 2.7 | 2.64 | 2.91 | 3.26 | 2.84 | 2.84 | 2.84 | 2.84 | 2.84 |
| EBIT | 624.1 | 631.3 | 716.0 | 836.5 | 836.7 | 796.1 | 829.1 | 863.5 | 899.3 | 936.6 |
| EBIT, % | 6.17 | 6.14 | 5.95 | 7.09 | 7.1 | 6.49 | 6.49 | 6.49 | 6.49 | 6.49 |
| Total Cash | 944.3 | 776.9 | 1,504.0 | 1,426.1 | 1,432.9 | 1,315.8 | 1,370.4 | 1,427.2 | 1,486.4 | 1,548.0 |
| Total Cash, percent | .0 | .0 | .0 | .0 | .0 | .0 | .0 | .0 | .0 | .0 |
| Account Receivables | 1,306.3 | 1,344.2 | 1,469.5 | 1,287.3 | 1,541.7 | 1,525.7 | 1,589.0 | 1,654.9 | 1,723.5 | 1,795.0 |
| Account Receivables, % | 12.92 | 13.07 | 12.21 | 10.91 | 13.09 | 12.44 | 12.44 | 12.44 | 12.44 | 12.44 |
| Inventories | 1,432.2 | 1,474.0 | 1,748.6 | 1,621.1 | 1,760.9 | 1,759.1 | 1,832.1 | 1,908.1 | 1,987.2 | 2,069.6 |
| Inventories, % | 14.16 | 14.33 | 14.52 | 13.74 | 14.95 | 14.34 | 14.34 | 14.34 | 14.34 | 14.34 |
| Accounts Payable | 1,080.4 | 1,216.6 | 1,440.9 | 1,290.1 | 1,392.9 | 1,404.2 | 1,462.5 | 1,523.1 | 1,586.3 | 1,652.1 |
| Accounts Payable, % | 10.69 | 11.83 | 11.97 | 10.94 | 11.83 | 11.45 | 11.45 | 11.45 | 11.45 | 11.45 |
| Capital Expenditure | -33.1 | -32.7 | -46.7 | -58.3 | -54.4 | -48.8 | -50.8 | -52.9 | -55.1 | -57.4 |
| Capital Expenditure, % | -0.32736 | -0.31794 | -0.38789 | -0.49419 | -0.46194 | -0.39786 | -0.39786 | -0.39786 | -0.39786 | -0.39786 |
| Tax Rate, % | 25.71 | 25.71 | 25.71 | 25.71 | 25.71 | 25.71 | 25.71 | 25.71 | 25.71 | 25.71 |
| EBITAT | 482.9 | 491.5 | 535.3 | 630.1 | 621.6 | 604.4 | 629.4 | 655.6 | 682.7 | 711.1 |
| Depreciation | ||||||||||
| Changes in Account Receivables | ||||||||||
| Changes in Inventories | ||||||||||
| Changes in Accounts Payable | ||||||||||
| Capital Expenditure | ||||||||||
| UFCF | -936.2 | 793.0 | 630.9 | 1,073.5 | 659.9 | 933.0 | 863.4 | 899.2 | 936.5 | 975.3 |
| WACC, % | 4.76 | 4.76 | 4.72 | 4.73 | 4.71 | 4.74 | 4.74 | 4.74 | 4.74 | 4.74 |
| PV UFCF | ||||||||||
| SUM PV UFCF | 4,012.6 | |||||||||
| Long Term Growth Rate, % | 2.00 | |||||||||
| Free cash flow (T + 1) | 995 | |||||||||
| Terminal Value | 36,361 | |||||||||
| Present Terminal Value | 28,851 | |||||||||
| Enterprise Value | 32,863 | |||||||||
| Net Debt | 2,290 | |||||||||
| Equity Value | 30,573 | |||||||||
| Diluted Shares Outstanding, MM | 337 | |||||||||
| Equity Value Per Share | 9,085.68 |
What You Will Receive
- Authentic Bunzl Data: Comprehensive financial information – from revenue to EBIT – based on actual and projected data.
- Complete Customization: Modify all key parameters (yellow cells) such as WACC, growth %, and tax rates to suit your analysis.
- Immediate Valuation Updates: Automatic recalculations to assess the effects of changes on Bunzl's fair value.
- Flexible Excel Template: Designed for quick modifications, scenario analyses, and extensive projections.
- Efficient and Precise: Eliminate the need to build models from the ground up while ensuring accuracy and adaptability.
Key Features
- Advanced DCF Calculator: Features comprehensive unlevered and levered DCF valuation models tailored for Bunzl plc (BNZLL).
- WACC Calculator: Ready-to-use Weighted Average Cost of Capital template with adjustable parameters.
- Customizable Forecast Assumptions: Update growth rates, capital expenditures, and discount rates as needed.
- Integrated Financial Ratios: Evaluate profitability, leverage, and efficiency ratios specific to Bunzl plc (BNZLL).
- Interactive Dashboard and Charts: Visual representations highlight key valuation metrics for straightforward analysis.
How It Functions
- 1. Access the Template: Download and open the Excel file containing Bunzl plc’s preloaded data.
- 2. Modify Assumptions: Adjust crucial inputs such as growth rates, WACC, and capital expenditures.
- 3. View Real-Time Results: The DCF model automatically calculates intrinsic value and NPV.
- 4. Explore Multiple Scenarios: Analyze various forecasts to evaluate different valuation outcomes.
- 5. Present with Confidence: Share professional valuation insights that back your decisions.
Why Opt for This Calculator?
- All-in-One Solution: Features DCF, WACC, and financial ratio analyses bundled together.
- Flexible Inputs: Modify yellow-highlighted fields to explore different scenarios.
- In-Depth Analysis: Automatically computes Bunzl plc’s intrinsic value and Net Present Value.
- Preloaded Information: Includes historical and projected data for reliable starting points.
- High-Quality Standards: Perfect for financial analysts, investors, and business consultants alike.
Who Can Benefit from This Product?
- Individual Investors: Make well-informed decisions regarding the purchase or sale of Bunzl plc (BNZLL) shares.
- Financial Analysts: Enhance valuation processes with comprehensive, readily available financial models.
- Consultants: Provide clients with timely and precise valuation insights related to Bunzl plc (BNZLL).
- Business Owners: Gain an understanding of how large entities like Bunzl plc (BNZLL) are valued to refine your own business strategies.
- Finance Students: Explore valuation methodologies using actual data and real-life case studies involving Bunzl plc (BNZLL).
Contents of the Template
- Preloaded BNZLL Data: Historical and projected financial information, covering revenue, EBIT, and capital expenditures.
- DCF and WACC Models: Expert-level worksheets designed for calculating intrinsic value and the Weighted Average Cost of Capital.
- Editable Inputs: Yellow-highlighted fields for modifying revenue growth, tax rates, and discount rates.
- Financial Statements: Detailed annual and quarterly financial reports for in-depth analysis.
- Key Ratios: Metrics for profitability, leverage, and efficiency to assess performance.
- Dashboard and Charts: Visual summaries displaying valuation results and underlying assumptions.
Disclaimer
All information, articles, and product details provided on this website are for general informational and educational purposes only. We do not claim any ownership over, nor do we intend to infringe upon, any trademarks, copyrights, logos, brand names, or other intellectual property mentioned or depicted on this site. Such intellectual property remains the property of its respective owners, and any references here are made solely for identification or informational purposes, without implying any affiliation, endorsement, or partnership.
We make no representations or warranties, express or implied, regarding the accuracy, completeness, or suitability of any content or products presented. Nothing on this website should be construed as legal, tax, investment, financial, medical, or other professional advice. In addition, no part of this site—including articles or product references—constitutes a solicitation, recommendation, endorsement, advertisement, or offer to buy or sell any securities, franchises, or other financial instruments, particularly in jurisdictions where such activity would be unlawful.
All content is of a general nature and may not address the specific circumstances of any individual or entity. It is not a substitute for professional advice or services. Any actions you take based on the information provided here are strictly at your own risk. You accept full responsibility for any decisions or outcomes arising from your use of this website and agree to release us from any liability in connection with your use of, or reliance upon, the content or products found herein.