
|
Biopharma Credit PLC (BPCP.L) DCF -Bewertung |
Fully Editable: Tailor To Your Needs In Excel Or Sheets
Professional Design: Trusted, Industry-Standard Templates
Investor-Approved Valuation Models
MAC/PC Compatible, Fully Unlocked
No Expertise Is Needed; Easy To Follow
BioPharma Credit PLC (BPCP.L) Bundle
Stürzen Sie Ihre Analyse und verbessern Sie die Präzision mit unserem (BPCPL) DCF -Taschenrechner! Mithilfe der tatsächlichen Daten von Biopharma Credit PLC und anpassbaren Annahmen können Sie dieses Tool wie einen erfahrenen Investor prognostizieren, bewerten und bewerten.
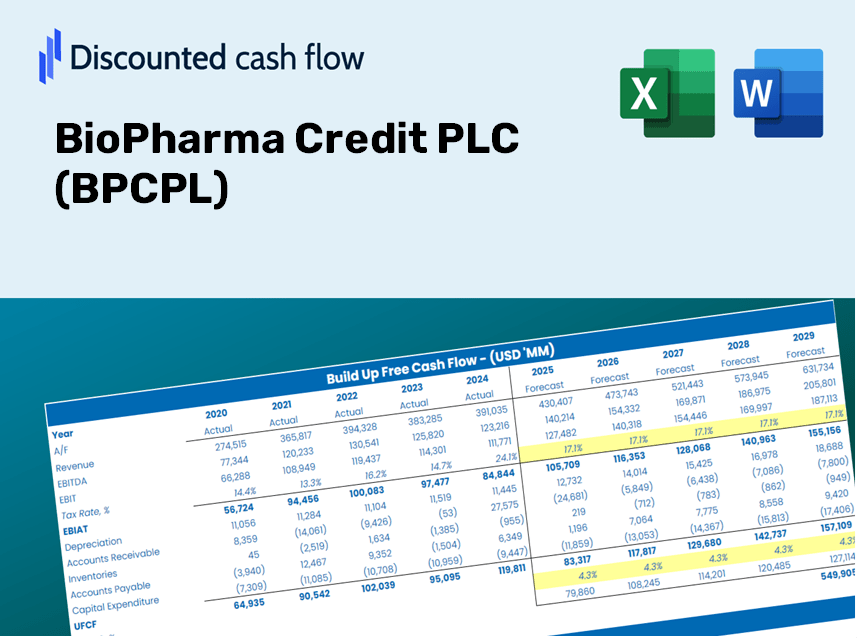
Discounted Cash Flow (DCF) - (USD MM)
| Year | AY1 2020 |
AY2 2021 |
AY3 2022 |
AY4 2023 |
AY5 2024 |
FY1 2025 |
FY2 2026 |
FY3 2027 |
FY4 2028 |
FY5 2029 |
|---|---|---|---|---|---|---|---|---|---|---|
| Revenue | 67.6 | 65.1 | 136.3 | 100.4 | 92.1 | 106.3 | 122.6 | 141.5 | 163.4 | 188.5 |
| Revenue Growth, % | 0 | -3.7 | 109.44 | -26.33 | -8.31 | 15.41 | 15.41 | 15.41 | 15.41 | 15.41 |
| EBITDA | .0 | .0 | .0 | .0 | 90.4 | 20.9 | 24.1 | 27.8 | 32.1 | 37.0 |
| EBITDA, % | 0 | 0 | 0 | 0 | 98.17 | 19.63 | 19.63 | 19.63 | 19.63 | 19.63 |
| Depreciation | -66.0 | -62.9 | -134.9 | -80.2 | -90.4 | -100.1 | -115.6 | -133.4 | -154.0 | -177.7 |
| Depreciation, % | -97.59 | -96.6 | -98.97 | -79.9 | -98.17 | -94.24 | -94.24 | -94.24 | -94.24 | -94.24 |
| EBIT | 66.0 | 62.9 | 134.9 | 80.2 | 180.8 | 100.5 | 116.0 | 133.9 | 154.6 | 178.4 |
| EBIT, % | 97.59 | 96.6 | 98.97 | 79.9 | 196.34 | 94.61 | 94.61 | 94.61 | 94.61 | 94.61 |
| Total Cash | 143.0 | 70.1 | 89.2 | 99.9 | 4.2 | 78.5 | 90.6 | 104.6 | 120.7 | 139.3 |
| Total Cash, percent | .0 | .0 | .0 | .0 | .0 | .0 | .0 | .0 | .0 | .0 |
| Account Receivables | .0 | 7.1 | 14.6 | 15.0 | 23.5 | 13.2 | 15.2 | 17.6 | 20.3 | 23.4 |
| Account Receivables, % | 0.00328396 | 10.91 | 10.71 | 14.9 | 25.55 | 12.41 | 12.41 | 12.41 | 12.41 | 12.41 |
| Inventories | .0 | .0 | -.1 | .0 | .0 | .0 | .0 | .0 | .0 | .0 |
| Inventories, % | 0 | 0 | -0.06024587 | 0 | 0 | -0.01204917 | -0.01204917 | -0.01204917 | -0.01204917 | -0.01204917 |
| Accounts Payable | 6.9 | 1.6 | .0 | .0 | .7 | 2.9 | 3.3 | 3.8 | 4.4 | 5.1 |
| Accounts Payable, % | 10.28 | 2.53 | 0 | 0 | 0.7601 | 2.71 | 2.71 | 2.71 | 2.71 | 2.71 |
| Capital Expenditure | .0 | .0 | .0 | .0 | .0 | .0 | .0 | .0 | .0 | .0 |
| Capital Expenditure, % | 0 | 0 | 0 | 0 | 0 | 0 | 0 | 0 | 0 | 0 |
| Tax Rate, % | 0 | 0 | 0 | 0 | 0 | 0 | 0 | 0 | 0 | 0 |
| EBITAT | 66.0 | 62.9 | 134.9 | 80.2 | 180.8 | 100.5 | 116.0 | 133.9 | 154.6 | 178.4 |
| Depreciation | ||||||||||
| Changes in Account Receivables | ||||||||||
| Changes in Inventories | ||||||||||
| Changes in Accounts Payable | ||||||||||
| Capital Expenditure | ||||||||||
| UFCF | 6.9 | -12.4 | -9.1 | -.5 | 82.5 | 12.9 | -1.1 | -1.3 | -1.5 | -1.7 |
| WACC, % | 4.66 | 4.66 | 4.66 | 4.66 | 4.66 | 4.66 | 4.66 | 4.66 | 4.66 | 4.66 |
| PV UFCF | ||||||||||
| SUM PV UFCF | 7.5 | |||||||||
| Long Term Growth Rate, % | 2.00 | |||||||||
| Free cash flow (T + 1) | -2 | |||||||||
| Terminal Value | -67 | |||||||||
| Present Terminal Value | -53 | |||||||||
| Enterprise Value | -46 | |||||||||
| Net Debt | -4 | |||||||||
| Equity Value | -42 | |||||||||
| Diluted Shares Outstanding, MM | 1,222 | |||||||||
| Equity Value Per Share | -3.41 |
Benefits of Choosing BioPharma Credit PLC (BPCPL)
- Authentic Financial Data: Access preloaded financial metrics – including revenue and EBIT – derived from real and projected data.
- Comprehensive Customization: Modify all essential parameters (yellow cells) such as WACC, growth percentage, and tax rates.
- Real-Time Valuation Adjustments: Automatic updates to evaluate how modifications affect the fair value of BioPharma Credit PLC (BPCPL).
- Flexible Excel Template: Designed for easy editing, scenario analysis, and thorough financial forecasts.
- Efficient and Precise: Eliminate the need to build models from the ground up while ensuring accuracy and adaptability.
Key Features
- 🔍 Real-Life BPCPL Financials: Access pre-filled historical and projected data for BioPharma Credit PLC (BPCPL).
- ✏️ Fully Customizable Inputs: Modify all essential parameters (highlighted cells) such as WACC, growth %, and tax rates.
- 📊 Professional DCF Valuation: Integrated formulas calculate the intrinsic value of BioPharma Credit PLC (BPCPL) using the Discounted Cash Flow method.
- ⚡ Instant Results: View the valuation of BioPharma Credit PLC (BPCPL) immediately after making any adjustments.
- Scenario Analysis: Evaluate and compare results for different financial assumptions side-by-side.
How It Operates
- 1. Access the Template: Download and open the Excel file featuring BioPharma Credit PLC’s (BPCPL) pre-existing data.
- 2. Modify Assumptions: Adjust critical inputs such as growth rates, WACC, and capital expenditures as needed.
- 3. Examine Results Immediately: The DCF model automatically computes the intrinsic value and NPV in real-time.
- 4. Evaluate Scenarios: Analyze various forecasts to explore different valuation possibilities.
- 5. Present with Assurance: Share well-founded valuation insights to bolster your decision-making process.
Why Choose This Calculator for BioPharma Credit PLC (BPCPL)?
- User-Friendly Interface: Suitable for both novice and experienced users.
- Customizable Inputs: Easily adjust parameters to fit your specific analysis needs.
- Real-Time Valuation: Watch immediate updates to BioPharma Credit's valuation as you change inputs.
- Preloaded Financials: Comes with BioPharma Credit's actual financial data for quick and efficient analysis.
- Widely Used by Experts: Favored by investors and analysts for well-informed decision-making.
Who Can Benefit from This Product?
- Institutional Investors: Create comprehensive and trustworthy valuation models for analyzing portfolios related to BioPharma Credit PLC (BPCPL).
- Corporate Finance Departments: Evaluate various valuation scenarios to inform strategic decisions within their organizations.
- Financial Consultants and Advisors: Deliver precise valuation insights to clients interested in BioPharma Credit PLC (BPCPL) investments.
- Students and Educators: Utilize real-world data to enhance learning and practical applications in financial modeling.
- Healthcare Investors: Gain insights into how companies like BioPharma Credit PLC (BPCPL) are valued in the financial market.
Overview of the Template's Features
- Pre-Filled Data: Includes BioPharma Credit PLC's (BPCPL) historical financials and projections.
- Discounted Cash Flow Model: An editable DCF valuation model with automated calculations.
- Weighted Average Cost of Capital (WACC): A separate sheet designed for calculating WACC using customized inputs.
- Key Financial Ratios: Assess BPCPL's profitability, efficiency, and leverage metrics.
- Customizable Inputs: Easily modify revenue growth rates, profit margins, and tax rates.
- Clear Dashboard: Visual representations and tables that summarize essential valuation outcomes.
Disclaimer
All information, articles, and product details provided on this website are for general informational and educational purposes only. We do not claim any ownership over, nor do we intend to infringe upon, any trademarks, copyrights, logos, brand names, or other intellectual property mentioned or depicted on this site. Such intellectual property remains the property of its respective owners, and any references here are made solely for identification or informational purposes, without implying any affiliation, endorsement, or partnership.
We make no representations or warranties, express or implied, regarding the accuracy, completeness, or suitability of any content or products presented. Nothing on this website should be construed as legal, tax, investment, financial, medical, or other professional advice. In addition, no part of this site—including articles or product references—constitutes a solicitation, recommendation, endorsement, advertisement, or offer to buy or sell any securities, franchises, or other financial instruments, particularly in jurisdictions where such activity would be unlawful.
All content is of a general nature and may not address the specific circumstances of any individual or entity. It is not a substitute for professional advice or services. Any actions you take based on the information provided here are strictly at your own risk. You accept full responsibility for any decisions or outcomes arising from your use of this website and agree to release us from any liability in connection with your use of, or reliance upon, the content or products found herein.