
|
DCF -Bewertung der Blueprint Medicines Corporation (BPMC) |
Fully Editable: Tailor To Your Needs In Excel Or Sheets
Professional Design: Trusted, Industry-Standard Templates
Investor-Approved Valuation Models
MAC/PC Compatible, Fully Unlocked
No Expertise Is Needed; Easy To Follow
Blueprint Medicines Corporation (BPMC) Bundle
Unser DCF-Taschenrechner von Blueprint Medicines Corporation (BPMC) für Genauigkeit ermöglicht es Ihnen, die Bewertung der Blueprint Medicines Corporation mit realen Finanzdaten zu bewerten und vollständige Flexibilität zu bieten, um alle wesentlichen Parameter für verbesserte Projektionen zu ändern.
What You Will Get
- Real BPMC Financials: Access to historical and projected data for precise valuation.
- Customizable Inputs: Adjust WACC, tax rates, revenue growth, and capital expenditures as needed.
- Automated Calculations: Intrinsic value and NPV are computed in real-time.
- Scenario Analysis: Evaluate various scenarios to assess Blueprint Medicines Corporation’s future performance.
- User-Friendly Design: Designed for professionals while remaining approachable for newcomers.
Key Features
- 🔍 Real-Life BPMC Financials: Pre-filled historical and projected data for Blueprint Medicines Corporation (BPMC).
- ✏️ Fully Customizable Inputs: Adjust all critical parameters (yellow cells) like WACC, growth %, and tax rates.
- 📊 Professional DCF Valuation: Built-in formulas calculate Blueprint Medicines' intrinsic value using the Discounted Cash Flow method.
- ⚡ Instant Results: Visualize Blueprint Medicines' valuation instantly after making changes.
- Scenario Analysis: Test and compare outcomes for various financial assumptions side-by-side.
How It Works
- Step 1: Download the Excel file.
- Step 2: Review pre-entered Blueprint Medicines Corporation (BPMC) data (historical and projected).
- Step 3: Adjust key assumptions (yellow cells) based on your analysis.
- Step 4: View automatic recalculations for Blueprint Medicines Corporation (BPMC)’s intrinsic value.
- Step 5: Use the outputs for investment decisions or reporting.
Why Choose Blueprint Medicines Corporation (BPMC)?
- Innovative Treatments: Pioneering therapies for patients with genomically defined cancers.
- Expertise in Precision Medicine: Focused on targeted therapies that address unmet medical needs.
- Strong Pipeline: Robust development of drug candidates with significant potential.
- Commitment to Patients: Dedicated to improving the lives of those affected by rare diseases.
- Proven Track Record: Backed by a team of industry leaders with extensive experience.
Who Should Use This Product?
- Healthcare Professionals: Understand the latest advancements in precision medicine and their applications.
- Researchers: Utilize comprehensive data and models for studies related to targeted therapies.
- Investors: Evaluate your strategies and assess the potential of Blueprint Medicines Corporation (BPMC) in your portfolio.
- Pharmaceutical Analysts: Enhance your analysis with a customizable model for drug development valuations.
- Biotech Entrepreneurs: Learn from the market strategies of established companies like Blueprint Medicines Corporation (BPMC).
What the Template Contains
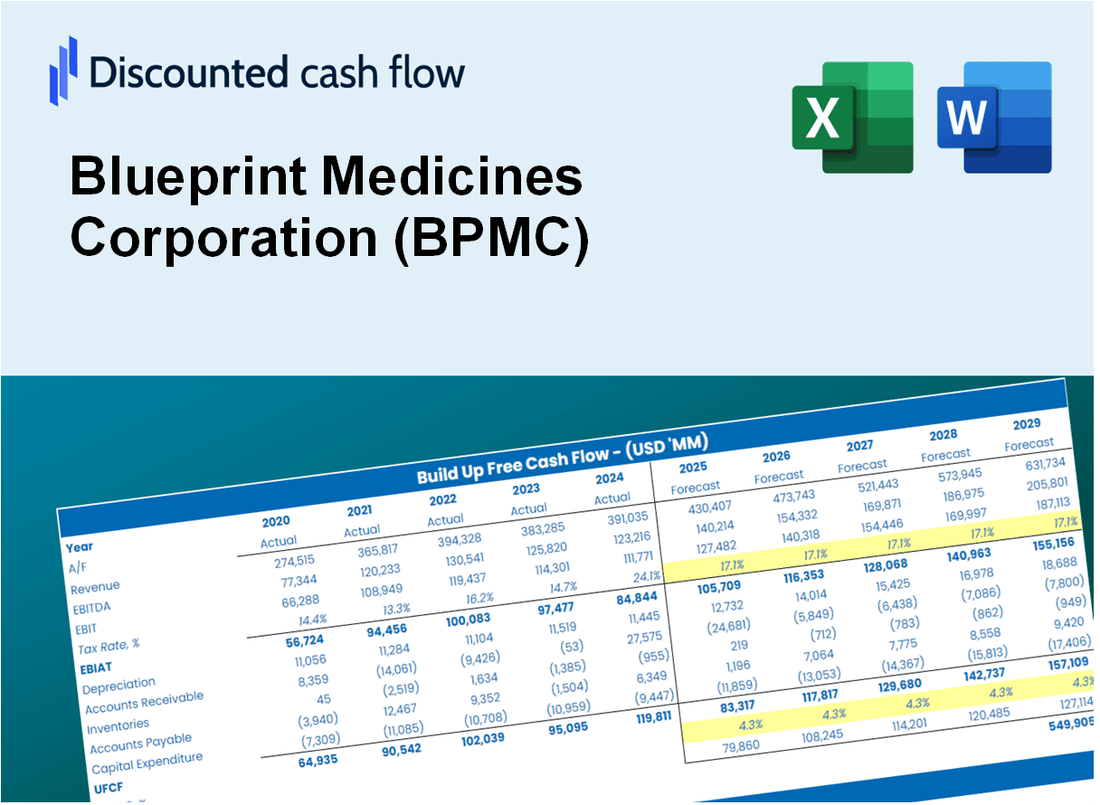
- Operating and Balance Sheet Data: Pre-filled Blueprint Medicines Corporation (BPMC) historical data and forecasts, including revenue, EBITDA, EBIT, and capital expenditures.
- WACC Calculation: A dedicated sheet for Weighted Average Cost of Capital (WACC), featuring parameters like Beta, risk-free rate, and share price.
- DCF Valuation (Unlevered and Levered): Editable Discounted Cash Flow models displaying intrinsic value with comprehensive calculations.
- Financial Statements: Pre-loaded financial statements (annual and quarterly) to facilitate thorough analysis.
- Key Ratios: Includes profitability, leverage, and efficiency ratios specific to Blueprint Medicines Corporation (BPMC).
- Dashboard and Charts: Visual summary of valuation outputs and assumptions for easy analysis of results.
Disclaimer
All information, articles, and product details provided on this website are for general informational and educational purposes only. We do not claim any ownership over, nor do we intend to infringe upon, any trademarks, copyrights, logos, brand names, or other intellectual property mentioned or depicted on this site. Such intellectual property remains the property of its respective owners, and any references here are made solely for identification or informational purposes, without implying any affiliation, endorsement, or partnership.
We make no representations or warranties, express or implied, regarding the accuracy, completeness, or suitability of any content or products presented. Nothing on this website should be construed as legal, tax, investment, financial, medical, or other professional advice. In addition, no part of this site—including articles or product references—constitutes a solicitation, recommendation, endorsement, advertisement, or offer to buy or sell any securities, franchises, or other financial instruments, particularly in jurisdictions where such activity would be unlawful.
All content is of a general nature and may not address the specific circumstances of any individual or entity. It is not a substitute for professional advice or services. Any actions you take based on the information provided here are strictly at your own risk. You accept full responsibility for any decisions or outcomes arising from your use of this website and agree to release us from any liability in connection with your use of, or reliance upon, the content or products found herein.