
|
Belling Brands, Inc. (BRBR) DCF -Bewertung |
Fully Editable: Tailor To Your Needs In Excel Or Sheets
Professional Design: Trusted, Industry-Standard Templates
Investor-Approved Valuation Models
MAC/PC Compatible, Fully Unlocked
No Expertise Is Needed; Easy To Follow
BellRing Brands, Inc. (BRBR) Bundle
Bewerten Sie die finanzielle Aussichten von Belling Brands, Inc. (BRBR) wie ein Experte! Dieser (BRBR) DCF-Taschenrechner verfügt über vorgefüllte Finanzdaten und bietet eine vollständige Flexibilität, um das Umsatzwachstum, WACC, Margen und andere wichtige Annahmen zu ändern, um sich mit Ihren Erwartungen anzupassen.
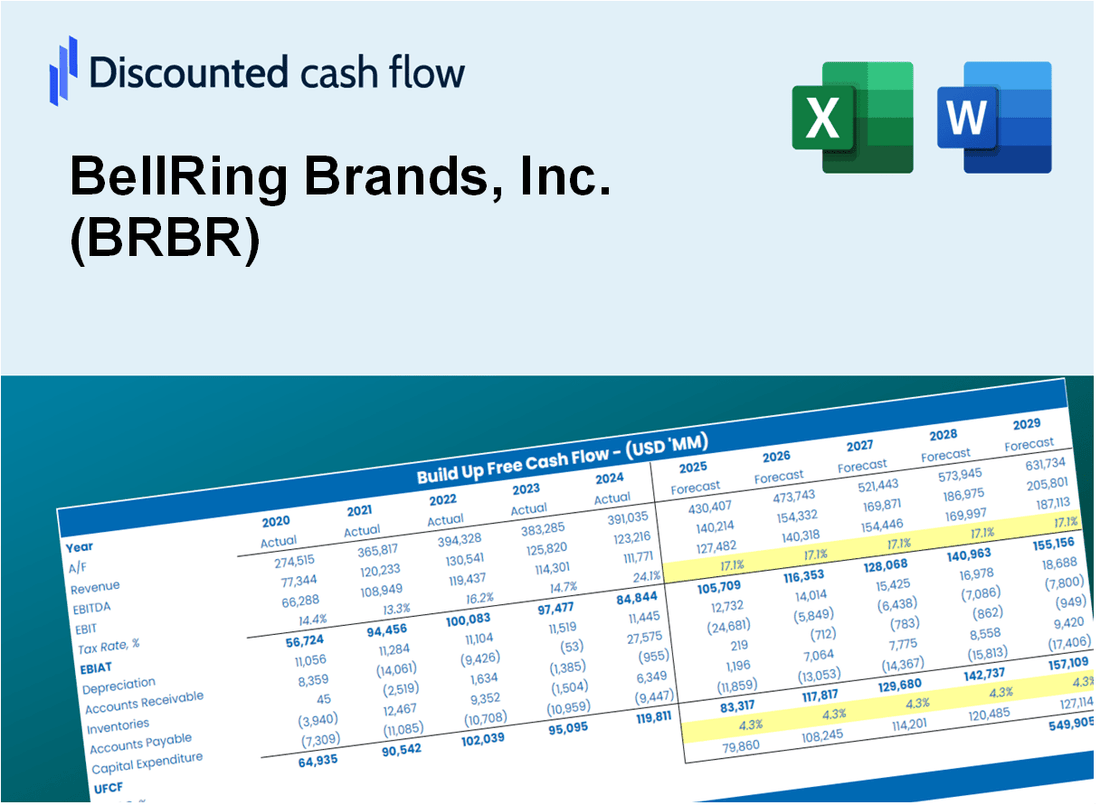
Discounted Cash Flow (DCF) - (USD MM)
| Year | AY1 2020 |
AY2 2021 |
AY3 2022 |
AY4 2023 |
AY5 2024 |
FY1 2025 |
FY2 2026 |
FY3 2027 |
FY4 2028 |
FY5 2029 |
|---|---|---|---|---|---|---|---|---|---|---|
| Revenue | 988.3 | 1,247.1 | 1,371.5 | 1,666.8 | 1,996.2 | 2,382.7 | 2,844.1 | 3,394.9 | 4,052.2 | 4,836.9 |
| Revenue Growth, % | 0 | 26.19 | 9.98 | 21.53 | 19.76 | 19.36 | 19.36 | 19.36 | 19.36 | 19.36 |
| EBITDA | 191.2 | 220.1 | 216.1 | 315.6 | 424.2 | 442.9 | 528.6 | 631.0 | 753.2 | 899.0 |
| EBITDA, % | 19.35 | 17.65 | 15.76 | 18.93 | 21.25 | 18.59 | 18.59 | 18.59 | 18.59 | 18.59 |
| Depreciation | 25.3 | 53.7 | 21.3 | 28.3 | 36.5 | 56.9 | 67.9 | 81.1 | 96.8 | 115.6 |
| Depreciation, % | 2.56 | 4.31 | 1.55 | 1.7 | 1.83 | 2.39 | 2.39 | 2.39 | 2.39 | 2.39 |
| EBIT | 165.9 | 166.4 | 194.8 | 287.3 | 387.7 | 386.0 | 460.7 | 549.9 | 656.4 | 783.5 |
| EBIT, % | 16.79 | 13.34 | 14.2 | 17.24 | 19.42 | 16.2 | 16.2 | 16.2 | 16.2 | 16.2 |
| Total Cash | 48.7 | 152.6 | 35.8 | 48.4 | 71.1 | 125.0 | 149.3 | 178.2 | 212.7 | 253.8 |
| Total Cash, percent | .0 | .0 | .0 | .0 | .0 | .0 | .0 | .0 | .0 | .0 |
| Account Receivables | 83.1 | 103.9 | 173.3 | 168.2 | 220.4 | 240.7 | 287.3 | 342.9 | 409.3 | 488.6 |
| Account Receivables, % | 8.41 | 8.33 | 12.64 | 10.09 | 11.04 | 10.1 | 10.1 | 10.1 | 10.1 | 10.1 |
| Inventories | 150.5 | 117.9 | 199.8 | 194.3 | 286.1 | 310.9 | 371.1 | 443.0 | 528.7 | 631.1 |
| Inventories, % | 15.23 | 9.45 | 14.57 | 11.66 | 14.33 | 13.05 | 13.05 | 13.05 | 13.05 | 13.05 |
| Accounts Payable | 56.7 | 91.9 | 93.8 | 85.0 | 119.1 | 147.8 | 176.4 | 210.6 | 251.3 | 300.0 |
| Accounts Payable, % | 5.74 | 7.37 | 6.84 | 5.1 | 5.97 | 6.2 | 6.2 | 6.2 | 6.2 | 6.2 |
| Capital Expenditure | -2.1 | -1.6 | -1.8 | -1.8 | -1.8 | -3.2 | -3.8 | -4.6 | -5.4 | -6.5 |
| Capital Expenditure, % | -0.21249 | -0.1283 | -0.13124 | -0.10799 | -0.09017133 | -0.13404 | -0.13404 | -0.13404 | -0.13404 | -0.13404 |
| Tax Rate, % | 25.17 | 25.17 | 25.17 | 25.17 | 25.17 | 25.17 | 25.17 | 25.17 | 25.17 | 25.17 |
| EBITAT | 151.9 | 154.5 | 155.2 | 215.7 | 290.1 | 319.6 | 381.5 | 455.4 | 543.5 | 648.8 |
| Depreciation | ||||||||||
| Changes in Account Receivables | ||||||||||
| Changes in Inventories | ||||||||||
| Changes in Accounts Payable | ||||||||||
| Capital Expenditure | ||||||||||
| UFCF | -1.8 | 253.6 | 25.3 | 244.0 | 214.9 | 356.9 | 367.4 | 438.6 | 523.5 | 624.9 |
| WACC, % | 7.11 | 7.13 | 6.95 | 6.89 | 6.89 | 6.99 | 6.99 | 6.99 | 6.99 | 6.99 |
| PV UFCF | ||||||||||
| SUM PV UFCF | 1,857.9 | |||||||||
| Long Term Growth Rate, % | 3.00 | |||||||||
| Free cash flow (T + 1) | 644 | |||||||||
| Terminal Value | 16,122 | |||||||||
| Present Terminal Value | 11,499 | |||||||||
| Enterprise Value | 13,357 | |||||||||
| Net Debt | 762 | |||||||||
| Equity Value | 12,595 | |||||||||
| Diluted Shares Outstanding, MM | 132 | |||||||||
| Equity Value Per Share | 95.20 |
What You Will Get
- Editable Excel Template: A fully customizable Excel-based DCF Calculator featuring pre-filled real BRBR financials.
- Real-World Data: Historical data and forward-looking estimates (as indicated in the highlighted cells).
- Forecast Flexibility: Adjust forecast assumptions such as revenue growth, EBITDA %, and WACC.
- Automatic Calculations: Instantly observe the effect of your inputs on BellRing Brands' valuation.
- Professional Tool: Designed for investors, CFOs, consultants, and financial analysts.
- User-Friendly Design: Organized for clarity and ease of use, complete with step-by-step instructions.
Key Features
- Real-Life BRBR Data: Pre-filled with BellRing Brands’ historical financials and forward-looking projections.
- Fully Customizable Inputs: Adjust revenue growth, margins, WACC, tax rates, and capital expenditures.
- Dynamic Valuation Model: Automatic updates to Net Present Value (NPV) and intrinsic value based on your inputs.
- Scenario Testing: Create multiple forecast scenarios to analyze different valuation outcomes.
- User-Friendly Design: Simple, structured, and designed for professionals and beginners alike.
How It Works
- Step 1: Download the Excel file.
- Step 2: Review pre-entered BellRing Brands data (historical and projected).
- Step 3: Adjust key assumptions (yellow cells) based on your analysis.
- Step 4: View automatic recalculations for BellRing Brands’ intrinsic value.
- Step 5: Use the outputs for investment decisions or reporting.
Why Choose This Calculator for BellRing Brands, Inc. (BRBR)?
- Designed for Industry Experts: A sophisticated tool utilized by financial analysts, CFOs, and industry consultants.
- Accurate Financials: BellRing's historical and projected financial data preloaded for precise analysis.
- Flexible Scenario Analysis: Effortlessly simulate various forecasts and assumptions.
- Comprehensive Outputs: Automatically computes intrinsic value, NPV, and essential financial metrics.
- User-Friendly Interface: Step-by-step guidance to help you navigate the calculation process.
Who Should Use This Product?
- Investors: Make informed choices with a comprehensive valuation tool tailored for BellRing Brands, Inc. (BRBR).
- Financial Analysts: Streamline your workflow with a customizable DCF model specifically designed for BRBR.
- Consultants: Effortlessly modify the template for impactful client presentations or detailed reports on BellRing Brands, Inc. (BRBR).
- Finance Enthusiasts: Enhance your knowledge of valuation methods through practical examples related to BRBR.
- Educators and Students: Utilize this resource as a hands-on learning tool in finance courses centered on BellRing Brands, Inc. (BRBR).
What the Template Contains
- Pre-Filled Data: Includes BellRing Brands, Inc.'s (BRBR) historical financials and forecasts.
- Discounted Cash Flow Model: Editable DCF valuation model with automatic calculations.
- Weighted Average Cost of Capital (WACC): A dedicated sheet for calculating WACC based on custom inputs.
- Key Financial Ratios: Analyze BellRing Brands, Inc.'s (BRBR) profitability, efficiency, and leverage.
- Customizable Inputs: Edit revenue growth, margins, and tax rates with ease.
- Clear Dashboard: Charts and tables summarizing key valuation results.
Disclaimer
All information, articles, and product details provided on this website are for general informational and educational purposes only. We do not claim any ownership over, nor do we intend to infringe upon, any trademarks, copyrights, logos, brand names, or other intellectual property mentioned or depicted on this site. Such intellectual property remains the property of its respective owners, and any references here are made solely for identification or informational purposes, without implying any affiliation, endorsement, or partnership.
We make no representations or warranties, express or implied, regarding the accuracy, completeness, or suitability of any content or products presented. Nothing on this website should be construed as legal, tax, investment, financial, medical, or other professional advice. In addition, no part of this site—including articles or product references—constitutes a solicitation, recommendation, endorsement, advertisement, or offer to buy or sell any securities, franchises, or other financial instruments, particularly in jurisdictions where such activity would be unlawful.
All content is of a general nature and may not address the specific circumstances of any individual or entity. It is not a substitute for professional advice or services. Any actions you take based on the information provided here are strictly at your own risk. You accept full responsibility for any decisions or outcomes arising from your use of this website and agree to release us from any liability in connection with your use of, or reliance upon, the content or products found herein.