
|
Bridge Investment Group Holdings Inc. (BRDG) DCF -Bewertung |
Fully Editable: Tailor To Your Needs In Excel Or Sheets
Professional Design: Trusted, Industry-Standard Templates
Investor-Approved Valuation Models
MAC/PC Compatible, Fully Unlocked
No Expertise Is Needed; Easy To Follow
Bridge Investment Group Holdings Inc. (BRDG) Bundle
Unabhängig davon, ob Sie ein Anleger oder Analyst sind, ist dieser (BRDG) DCF-Taschenrechner Ihre Anlaufstelle für eine genaue Bewertung. Mit realen Daten von Bridge Investment Group Holdings Inc. geladen können Sie Prognosen anpassen und die Auswirkungen in Echtzeit beobachten.
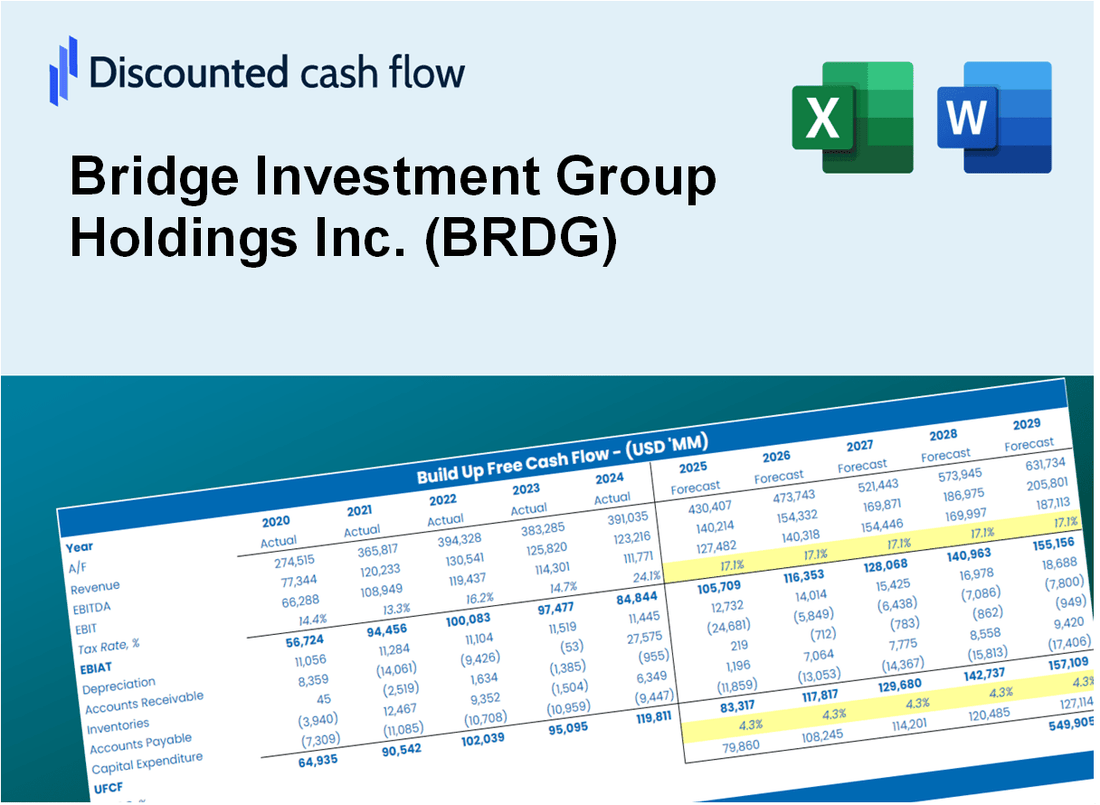
Discounted Cash Flow (DCF) - (USD MM)
| Year | AY1 2020 |
AY2 2021 |
AY3 2022 |
AY4 2023 |
AY5 2024 |
FY1 2025 |
FY2 2026 |
FY3 2027 |
FY4 2028 |
FY5 2029 |
|---|---|---|---|---|---|---|---|---|---|---|
| Revenue | 274.1 | 413.3 | 478.3 | 431.8 | 412.4 | 466.3 | 527.3 | 596.3 | 674.2 | 762.3 |
| Revenue Growth, % | 0 | 50.76 | 15.74 | -9.73 | -4.48 | 13.07 | 13.07 | 13.07 | 13.07 | 13.07 |
| EBITDA | 173.7 | 424.5 | 298.6 | -53.4 | 46.7 | 209.6 | 237.0 | 268.0 | 303.0 | 342.6 |
| EBITDA, % | 63.35 | 102.73 | 62.42 | -12.38 | 11.32 | 44.94 | 44.94 | 44.94 | 44.94 | 44.94 |
| Depreciation | 3.2 | 2.8 | 2.9 | 16.4 | 19.9 | 10.3 | 11.7 | 13.2 | 14.9 | 16.9 |
| Depreciation, % | 1.17 | 0.68478 | 0.6138 | 3.79 | 4.82 | 2.22 | 2.22 | 2.22 | 2.22 | 2.22 |
| EBIT | 170.4 | 421.7 | 295.6 | -69.8 | 26.8 | 199.9 | 226.0 | 255.6 | 289.0 | 326.8 |
| EBIT, % | 62.18 | 102.04 | 61.8 | -16.17 | 6.51 | 42.86 | 42.86 | 42.86 | 42.86 | 42.86 |
| Total Cash | 106.9 | 86.5 | 198.2 | 77.5 | 111.7 | 136.5 | 154.4 | 174.6 | 197.4 | 223.2 |
| Total Cash, percent | .0 | .0 | .0 | .0 | .0 | .0 | .0 | .0 | .0 | .0 |
| Account Receivables | 15.4 | 150.7 | 121.4 | 92.6 | 96.2 | 104.7 | 118.4 | 133.8 | 151.3 | 171.1 |
| Account Receivables, % | 5.6 | 36.46 | 25.39 | 21.46 | 23.32 | 22.45 | 22.45 | 22.45 | 22.45 | 22.45 |
| Inventories | .0 | 43.7 | .0 | .0 | .0 | 9.9 | 11.1 | 12.6 | 14.2 | 16.1 |
| Inventories, % | 0 | 10.56 | 0 | 0 | 0 | 2.11 | 2.11 | 2.11 | 2.11 | 2.11 |
| Accounts Payable | 11.1 | 13.6 | 24.9 | 34.6 | 39.2 | 28.0 | 31.7 | 35.9 | 40.6 | 45.9 |
| Accounts Payable, % | 4.06 | 3.29 | 5.21 | 8.01 | 9.5 | 6.01 | 6.01 | 6.01 | 6.01 | 6.01 |
| Capital Expenditure | -.3 | -1.1 | -3.2 | -2.4 | -.1 | -1.5 | -1.7 | -1.9 | -2.2 | -2.5 |
| Capital Expenditure, % | -0.09557823 | -0.27125 | -0.67485 | -0.55768 | -0.03006556 | -0.32588 | -0.32588 | -0.32588 | -0.32588 | -0.32588 |
| Tax Rate, % | 56.05 | 56.05 | 56.05 | 56.05 | 56.05 | 56.05 | 56.05 | 56.05 | 56.05 | 56.05 |
| EBITAT | 149.5 | 21.2 | 22.1 | -10.2 | 11.8 | 63.5 | 71.8 | 81.2 | 91.8 | 103.8 |
| Depreciation | ||||||||||
| Changes in Account Receivables | ||||||||||
| Changes in Inventories | ||||||||||
| Changes in Accounts Payable | ||||||||||
| Capital Expenditure | ||||||||||
| UFCF | 148.3 | -153.6 | 106.0 | 42.2 | 32.6 | 42.8 | 70.5 | 79.7 | 90.1 | 101.9 |
| WACC, % | 7.33 | 4.42 | 4.51 | 4.76 | 5.79 | 5.36 | 5.36 | 5.36 | 5.36 | 5.36 |
| PV UFCF | ||||||||||
| SUM PV UFCF | 323.8 | |||||||||
| Long Term Growth Rate, % | 2.00 | |||||||||
| Free cash flow (T + 1) | 104 | |||||||||
| Terminal Value | 3,090 | |||||||||
| Present Terminal Value | 2,380 | |||||||||
| Enterprise Value | 2,704 | |||||||||
| Net Debt | 357 | |||||||||
| Equity Value | 2,347 | |||||||||
| Diluted Shares Outstanding, MM | 33 | |||||||||
| Equity Value Per Share | 72.21 |
What You Will Get
- Real BRDG Financials: Access to historical and projected data for precise valuation.
- Customizable Inputs: Adjust WACC, tax rates, revenue growth, and capital expenditures as needed.
- Automated Calculations: Intrinsic value and NPV are computed in real-time.
- Scenario Analysis: Explore various scenarios to assess Bridge Investment Group's future performance.
- User-Friendly Design: Designed for professionals while remaining approachable for newcomers.
Key Features
- Comprehensive Data: Bridge Investment Group Holdings Inc.'s (BRDG) historical financial reports and pre-populated projections.
- Customizable Parameters: Adjust WACC, tax rates, revenue growth, and EBITDA margins as needed.
- Real-Time Insights: Instantly view the recalculated intrinsic value of Bridge Investment Group Holdings Inc. (BRDG).
- Intuitive Visualizations: Dashboard charts showcase valuation outcomes and essential metrics.
- Designed for Precision: A reliable tool for analysts, investors, and finance professionals.
How It Works
- 1. Access the Template: Download and open the Excel file containing Bridge Investment Group Holdings Inc.'s (BRDG) preloaded data.
- 2. Modify Assumptions: Adjust key inputs such as growth projections, WACC, and capital expenditures as needed.
- 3. View Results Instantly: The DCF model automatically calculates the intrinsic value and NPV based on your inputs.
- 4. Explore Scenarios: Analyze various forecasts to compare different valuation results.
- 5. Present with Assurance: Deliver professional valuation insights to back your investment decisions.
Why Choose This Calculator for Bridge Investment Group Holdings Inc. (BRDG)?
- Accuracy: Utilizes real Bridge Investment Group financials for precise data.
- Flexibility: Allows users to easily test and adjust inputs as needed.
- Time-Saving: Eliminates the complexities of creating a DCF model from the ground up.
- Professional-Grade: Crafted with the expertise and usability expected at the CFO level.
- User-Friendly: Simple to navigate, even for those with limited financial modeling skills.
Who Should Use This Product?
- Institutional Investors: Develop comprehensive investment strategies based on Bridge Investment Group Holdings Inc. (BRDG) performance.
- Asset Management Teams: Evaluate investment opportunities and risks associated with BRDG to enhance portfolio management.
- Financial Advisors: Deliver precise investment recommendations to clients considering Bridge Investment Group Holdings Inc. (BRDG).
- Academic Researchers: Analyze financial data for studies related to investment trends and market behavior.
- Market Analysts: Gain insights into the valuation and growth potential of Bridge Investment Group Holdings Inc. (BRDG).
What the Template Contains
- Pre-Filled Data: Contains historical financials and forecasts for Bridge Investment Group Holdings Inc. (BRDG).
- Discounted Cash Flow Model: An editable DCF valuation model featuring automatic calculations.
- Weighted Average Cost of Capital (WACC): A dedicated sheet for calculating WACC based on user-defined inputs.
- Key Financial Ratios: Evaluate Bridge Investment Group's profitability, efficiency, and leverage.
- Customizable Inputs: Easily modify revenue growth, margins, and tax rates.
- Clear Dashboard: Visual representations and tables summarizing essential valuation outcomes.
Disclaimer
All information, articles, and product details provided on this website are for general informational and educational purposes only. We do not claim any ownership over, nor do we intend to infringe upon, any trademarks, copyrights, logos, brand names, or other intellectual property mentioned or depicted on this site. Such intellectual property remains the property of its respective owners, and any references here are made solely for identification or informational purposes, without implying any affiliation, endorsement, or partnership.
We make no representations or warranties, express or implied, regarding the accuracy, completeness, or suitability of any content or products presented. Nothing on this website should be construed as legal, tax, investment, financial, medical, or other professional advice. In addition, no part of this site—including articles or product references—constitutes a solicitation, recommendation, endorsement, advertisement, or offer to buy or sell any securities, franchises, or other financial instruments, particularly in jurisdictions where such activity would be unlawful.
All content is of a general nature and may not address the specific circumstances of any individual or entity. It is not a substitute for professional advice or services. Any actions you take based on the information provided here are strictly at your own risk. You accept full responsibility for any decisions or outcomes arising from your use of this website and agree to release us from any liability in connection with your use of, or reliance upon, the content or products found herein.