
|
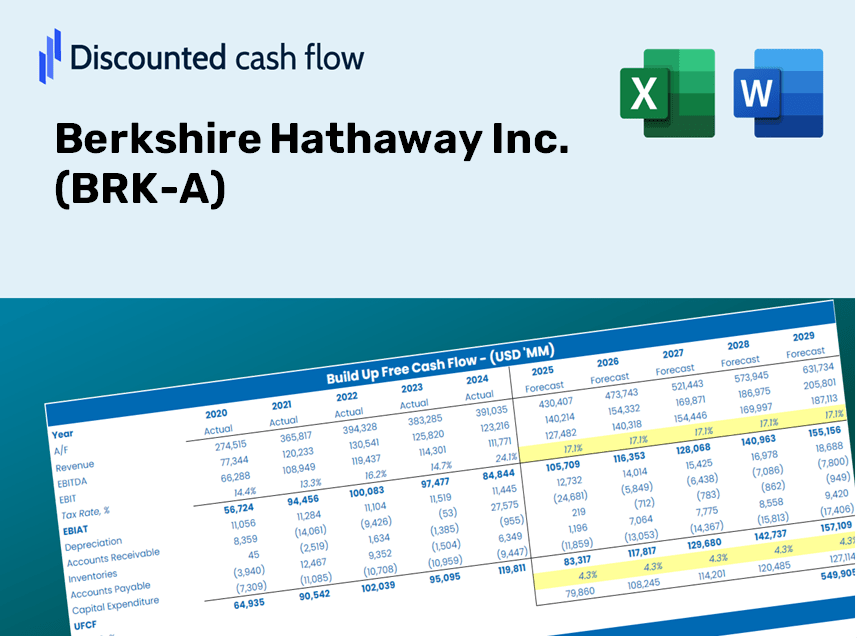
Berkshire Hathaway Inc. (BRK-A) DCF-Bewertung |
Fully Editable: Tailor To Your Needs In Excel Or Sheets
Professional Design: Trusted, Industry-Standard Templates
Investor-Approved Valuation Models
MAC/PC Compatible, Fully Unlocked
No Expertise Is Needed; Easy To Follow
Berkshire Hathaway Inc. (BRK-A) Bundle
Entdecken Sie die finanzielle Zukunft von Berkshire Hathaway Inc. (BRK-A) mit unserem benutzerfreundlichen DCF-Taschenrechner! Geben Sie Ihre Projektionen für Wachstum, Margen und Ausgaben ein, um den inneren Wert von Berkshire Hathaway Inc. (BRK-A) zu berechnen und Ihre Anlagestrategie zu verbessern.
Discounted Cash Flow (DCF) - (USD MM)
| Year | AY1 2020 |
AY2 2021 |
AY3 2022 |
AY4 2023 |
AY5 2024 |
FY1 2025 |
FY2 2026 |
FY3 2027 |
FY4 2028 |
FY5 2029 |
|---|---|---|---|---|---|---|---|---|---|---|
| Revenue | 221,519.0 | 278,272.0 | 299,104.0 | 372,166.0 | 376,776.0 | 432,135.5 | 495,628.9 | 568,451.4 | 651,973.6 | 747,767.7 |
| Revenue Growth, % | 0 | 25.62 | 7.49 | 24.43 | 1.24 | 14.69 | 14.69 | 14.69 | 14.69 | 14.69 |
| EBITDA | 70,372.0 | 126,751.0 | -15,249.0 | 137,655.0 | 128,431.0 | 123,844.3 | 142,040.7 | 162,910.6 | 186,847.0 | 214,300.3 |
| EBITDA, % | 31.77 | 45.55 | -5.1 | 36.99 | 34.09 | 28.66 | 28.66 | 28.66 | 28.66 | 28.66 |
| Depreciation | 10,596.0 | 10,718.0 | 10,899.0 | 12,486.0 | 12,855.0 | 16,460.6 | 18,879.1 | 21,653.0 | 24,834.5 | 28,483.4 |
| Depreciation, % | 4.78 | 3.85 | 3.64 | 3.35 | 3.41 | 3.81 | 3.81 | 3.81 | 3.81 | 3.81 |
| EBIT | 59,776.0 | 116,033.0 | -26,148.0 | 125,169.0 | 115,576.0 | 107,383.7 | 123,161.5 | 141,257.6 | 162,012.5 | 185,816.9 |
| EBIT, % | 26.98 | 41.7 | -8.74 | 33.63 | 30.67 | 24.85 | 24.85 | 24.85 | 24.85 | 24.85 |
| Total Cash | 138,290.0 | 146,719.0 | 128,585.0 | 167,641.0 | 334,201.0 | 252,270.3 | 289,336.3 | 331,848.3 | 380,606.6 | 436,528.9 |
| Total Cash, percent | .0 | .0 | .0 | .0 | .0 | .0 | .0 | .0 | .0 | .0 |
| Account Receivables | 55,053.0 | 60,316.0 | 71,493.0 | 75,941.0 | 76,188.0 | 95,982.7 | 110,085.4 | 126,260.2 | 144,811.5 | 166,088.6 |
| Account Receivables, % | 24.85 | 21.68 | 23.9 | 20.41 | 20.22 | 22.21 | 22.21 | 22.21 | 22.21 | 22.21 |
| Inventories | 19,208.0 | 20,954.0 | 25,366.0 | 24,159.0 | 24,008.0 | 32,449.2 | 37,216.9 | 42,685.2 | 48,956.9 | 56,150.1 |
| Inventories, % | 8.67 | 7.53 | 8.48 | 6.49 | 6.37 | 7.51 | 7.51 | 7.51 | 7.51 | 7.51 |
| Accounts Payable | 39,978.0 | 40,705.0 | 44,635.0 | 49,351.0 | 49,485.0 | 63,949.3 | 73,345.3 | 84,121.9 | 96,481.9 | 110,657.9 |
| Accounts Payable, % | 18.05 | 14.63 | 14.92 | 13.26 | 13.13 | 14.8 | 14.8 | 14.8 | 14.8 | 14.8 |
| Capital Expenditure | -13,012.0 | -13,276.0 | -15,464.0 | -19,409.0 | -18,976.0 | -22,528.5 | -25,838.6 | -29,635.1 | -33,989.4 | -38,983.4 |
| Capital Expenditure, % | -5.87 | -4.77 | -5.17 | -5.22 | -5.04 | -5.21 | -5.21 | -5.21 | -5.21 | -5.21 |
| Tax Rate, % | 19.37 | 19.37 | 19.37 | 19.37 | 19.37 | 19.37 | 19.37 | 19.37 | 19.37 | 19.37 |
| EBITAT | 45,638.3 | 93,291.3 | -19,511.6 | 100,229.2 | 93,187.7 | 84,204.6 | 96,576.7 | 110,766.7 | 127,041.5 | 145,707.7 |
| Depreciation | ||||||||||
| Changes in Account Receivables | ||||||||||
| Changes in Inventories | ||||||||||
| Changes in Accounts Payable | ||||||||||
| Capital Expenditure | ||||||||||
| UFCF | 8,939.3 | 84,451.3 | -35,735.6 | 94,781.2 | 87,104.7 | 64,365.0 | 80,142.8 | 91,918.1 | 105,423.6 | 120,913.4 |
| WACC, % | 6.77 | 6.78 | 6.76 | 6.78 | 6.78 | 6.77 | 6.77 | 6.77 | 6.77 | 6.77 |
| PV UFCF | ||||||||||
| SUM PV UFCF | 374,323.1 | |||||||||
| Long Term Growth Rate, % | 2.00 | |||||||||
| Free cash flow (T + 1) | 123,332 | |||||||||
| Terminal Value | 2,583,352 | |||||||||
| Present Terminal Value | 1,861,461 | |||||||||
| Enterprise Value | 2,235,784 | |||||||||
| Net Debt | 83,029 | |||||||||
| Equity Value | 2,152,755 | |||||||||
| Diluted Shares Outstanding, MM | 1 | |||||||||
| Equity Value Per Share | 1,497,048.22 |
What You Will Receive
- Authentic BRK-A Financial Data: Pre-filled with Berkshire Hathaway’s historical and projected figures for accurate analysis.
- Completely Customizable Template: Adjust essential inputs like revenue growth, WACC, and EBITDA % effortlessly.
- Instant Calculations: Observe Berkshire Hathaway’s intrinsic value update in real-time based on your modifications.
- Expert Valuation Tool: Tailored for investors, analysts, and consultants seeking precise DCF results.
- Intuitive Design: Streamlined layout and clear instructions suitable for all experience levels.
Key Features
- 🔍 Real-Life BRK-A Financials: Pre-filled historical and projected data for Berkshire Hathaway Inc.
- ✏️ Fully Customizable Inputs: Adjust all critical parameters (yellow cells) such as WACC, growth %, and tax rates.
- 📊 Professional DCF Valuation: Built-in formulas calculate Berkshire Hathaway’s intrinsic value using the Discounted Cash Flow method.
- ⚡ Instant Results: Visualize Berkshire Hathaway’s valuation instantly after making adjustments.
- Scenario Analysis: Test and compare outcomes for different financial assumptions side-by-side.
How It Works
- Step 1: Download the prebuilt Excel template featuring Berkshire Hathaway Inc.'s data.
- Step 2: Navigate through the pre-filled sheets to gain insights into key performance indicators.
- Step 3: Modify projections and assumptions in the editable yellow cells (WACC, growth, margins).
- Step 4: Instantly observe recalculated results, including Berkshire Hathaway Inc.'s intrinsic value.
- Step 5: Utilize the outputs to make well-informed investment decisions or create detailed reports.
Why Choose This Calculator for Berkshire Hathaway Inc. (BRK-A)?
- User-Friendly Design: Tailored for both novices and seasoned investors.
- Customizable Parameters: Adjust inputs effortlessly to suit your analysis needs.
- Real-Time Updates: Observe immediate changes in Berkshire Hathaway’s valuation as you modify inputs.
- Pre-Loaded Data: Comes equipped with Berkshire Hathaway’s real financial information for swift assessments.
- Preferred by Experts: Trusted by financial professionals and analysts for well-informed decision-making.
Who Can Benefit from This Product?
- Finance Students: Master valuation methods and practice with real-world data.
- Researchers: Utilize industry models in your academic projects or studies.
- Investors: Validate your hypotheses and evaluate valuation results for Berkshire Hathaway Inc. (BRK-A).
- Financial Analysts: Enhance your efficiency with a customizable, ready-to-use DCF model.
- Entrepreneurs: Discover how major public firms like Berkshire Hathaway Inc. (BRK-A) are assessed.
Contents of the Template
- Pre-Filled DCF Model: Berkshire Hathaway Inc.’s (BRK-A) financial data preloaded for immediate access.
- WACC Calculator: Comprehensive calculations for Weighted Average Cost of Capital.
- Financial Ratios: Assess Berkshire Hathaway’s (BRK-A) profitability, leverage, and operational efficiency.
- Editable Inputs: Adjust assumptions like growth, profit margins, and capital expenditures to suit your analysis.
- Financial Statements: Annual and quarterly reports included for thorough evaluation.
- Interactive Dashboard: Effortlessly visualize essential valuation metrics and outcomes.
Disclaimer
All information, articles, and product details provided on this website are for general informational and educational purposes only. We do not claim any ownership over, nor do we intend to infringe upon, any trademarks, copyrights, logos, brand names, or other intellectual property mentioned or depicted on this site. Such intellectual property remains the property of its respective owners, and any references here are made solely for identification or informational purposes, without implying any affiliation, endorsement, or partnership.
We make no representations or warranties, express or implied, regarding the accuracy, completeness, or suitability of any content or products presented. Nothing on this website should be construed as legal, tax, investment, financial, medical, or other professional advice. In addition, no part of this site—including articles or product references—constitutes a solicitation, recommendation, endorsement, advertisement, or offer to buy or sell any securities, franchises, or other financial instruments, particularly in jurisdictions where such activity would be unlawful.
All content is of a general nature and may not address the specific circumstances of any individual or entity. It is not a substitute for professional advice or services. Any actions you take based on the information provided here are strictly at your own risk. You accept full responsibility for any decisions or outcomes arising from your use of this website and agree to release us from any liability in connection with your use of, or reliance upon, the content or products found herein.