
|
Bentley Systems, Incorporated (BSY) DCF -Bewertung |
Fully Editable: Tailor To Your Needs In Excel Or Sheets
Professional Design: Trusted, Industry-Standard Templates
Investor-Approved Valuation Models
MAC/PC Compatible, Fully Unlocked
No Expertise Is Needed; Easy To Follow
Bentley Systems, Incorporated (BSY) Bundle
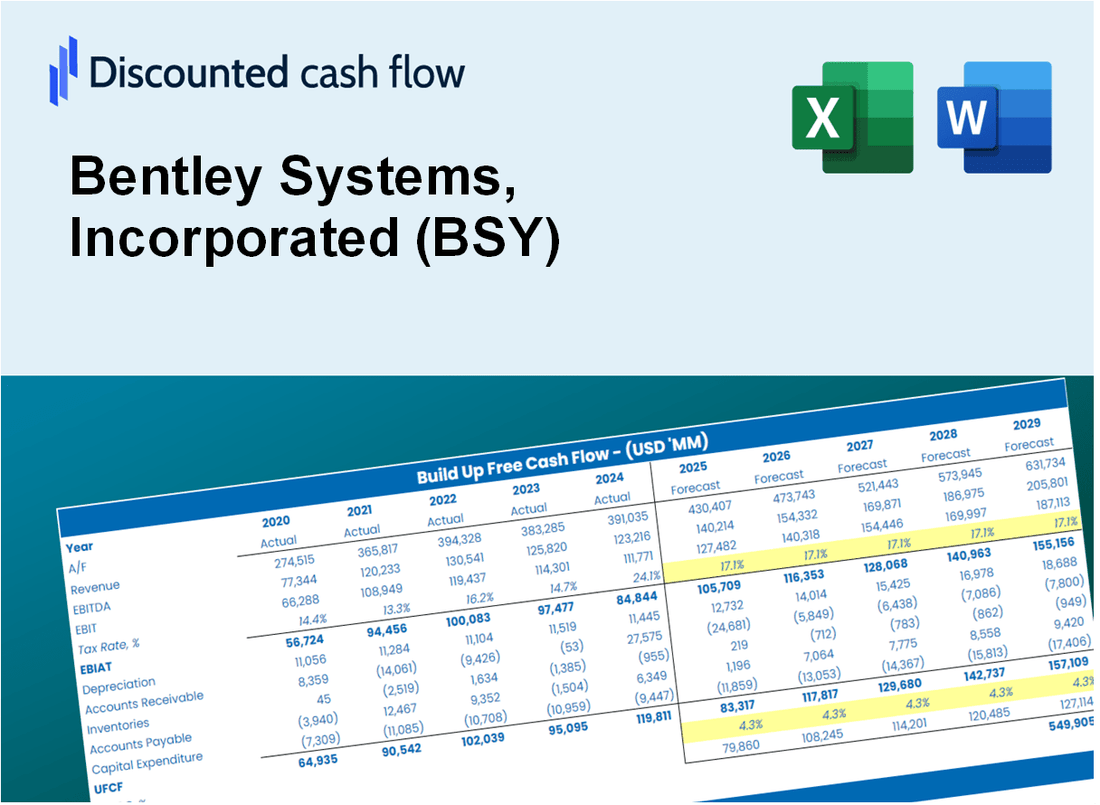
Als Anleger oder Analyst ist dieser (BSY) DCF-Taschenrechner Ihre Anlaufstelle für eine genaue Bewertung. Mit realen Daten von Bentley Systems, integriert, können Sie Prognosen anpassen und die Auswirkungen sofort beobachten.
Discounted Cash Flow (DCF) - (USD MM)
| Year | AY1 2020 |
AY2 2021 |
AY3 2022 |
AY4 2023 |
AY5 2024 |
FY1 2025 |
FY2 2026 |
FY3 2027 |
FY4 2028 |
FY5 2029 |
|---|---|---|---|---|---|---|---|---|---|---|
| Revenue | 801.5 | 965.0 | 1,099.1 | 1,228.4 | 1,353.1 | 1,543.2 | 1,760.1 | 2,007.4 | 2,289.4 | 2,611.1 |
| Revenue Growth, % | 0 | 20.4 | 13.89 | 11.77 | 10.15 | 14.05 | 14.05 | 14.05 | 14.05 | 14.05 |
| EBITDA | 211.0 | 152.3 | 304.9 | 288.4 | 382.4 | 375.3 | 428.0 | 488.1 | 556.7 | 635.0 |
| EBITDA, % | 26.32 | 15.79 | 27.74 | 23.48 | 28.26 | 24.32 | 24.32 | 24.32 | 24.32 | 24.32 |
| Depreciation | 36.1 | 44.9 | 71.5 | 63.6 | 64.6 | 79.1 | 90.2 | 102.9 | 117.3 | 133.8 |
| Depreciation, % | 4.51 | 4.66 | 6.51 | 5.18 | 4.77 | 5.12 | 5.12 | 5.12 | 5.12 | 5.12 |
| EBIT | 174.8 | 107.4 | 233.3 | 224.9 | 317.8 | 296.2 | 337.8 | 385.3 | 439.4 | 501.1 |
| EBIT, % | 21.81 | 11.13 | 21.23 | 18.3 | 23.49 | 19.19 | 19.19 | 19.19 | 19.19 | 19.19 |
| Total Cash | 122.0 | 329.3 | 71.7 | 68.4 | 64.0 | 204.2 | 232.9 | 265.7 | 303.0 | 345.6 |
| Total Cash, percent | .0 | .0 | .0 | .0 | .0 | .0 | .0 | .0 | .0 | .0 |
| Account Receivables | 190.0 | 235.3 | 287.1 | 293.5 | 314.5 | 374.5 | 427.1 | 487.2 | 555.6 | 633.7 |
| Account Receivables, % | 23.71 | 24.38 | 26.12 | 23.9 | 23.24 | 24.27 | 24.27 | 24.27 | 24.27 | 24.27 |
| Inventories | .0 | .0 | .0 | .0 | .0 | .0 | .0 | .0 | .0 | .0 |
| Inventories, % | 0 | 0 | 0 | 0 | 0 | 0 | 0 | 0 | 0 | 0 |
| Accounts Payable | 16.5 | 16.5 | 15.2 | 18.1 | 16.5 | 24.2 | 27.6 | 31.5 | 35.9 | 40.9 |
| Accounts Payable, % | 2.06 | 1.71 | 1.38 | 1.47 | 1.22 | 1.57 | 1.57 | 1.57 | 1.57 | 1.57 |
| Capital Expenditure | -16.4 | -17.5 | -18.5 | -25.0 | -14.0 | -26.6 | -30.4 | -34.6 | -39.5 | -45.1 |
| Capital Expenditure, % | -2.05 | -1.82 | -1.69 | -2.04 | -1.04 | -1.73 | -1.73 | -1.73 | -1.73 | -1.73 |
| Tax Rate, % | 19.91 | 19.91 | 19.91 | 19.91 | 19.91 | 19.91 | 19.91 | 19.91 | 19.91 | 19.91 |
| EBITAT | 133.9 | 107.2 | 208.0 | 400.4 | 254.5 | 264.0 | 301.1 | 343.4 | 391.7 | 446.7 |
| Depreciation | ||||||||||
| Changes in Account Receivables | ||||||||||
| Changes in Inventories | ||||||||||
| Changes in Accounts Payable | ||||||||||
| Capital Expenditure | ||||||||||
| UFCF | -19.9 | 89.4 | 207.9 | 435.4 | 282.6 | 264.1 | 311.7 | 355.5 | 405.5 | 462.4 |
| WACC, % | 8.88 | 8.96 | 8.92 | 8.96 | 8.89 | 8.92 | 8.92 | 8.92 | 8.92 | 8.92 |
| PV UFCF | ||||||||||
| SUM PV UFCF | 1,370.1 | |||||||||
| Long Term Growth Rate, % | 4.00 | |||||||||
| Free cash flow (T + 1) | 481 | |||||||||
| Terminal Value | 9,772 | |||||||||
| Present Terminal Value | 6,374 | |||||||||
| Enterprise Value | 7,744 | |||||||||
| Net Debt | 1,363 | |||||||||
| Equity Value | 6,381 | |||||||||
| Diluted Shares Outstanding, MM | 334 | |||||||||
| Equity Value Per Share | 19.12 |
What You Will Get
- Real Bentley Data: Preloaded financials – from revenue to EBIT – based on actual and projected figures for Bentley Systems, Incorporated (BSY).
- Full Customization: Adjust all critical parameters (yellow cells) like WACC, growth %, and tax rates to fit your analysis needs.
- Instant Valuation Updates: Automatic recalculations to analyze the impact of changes on Bentley’s fair value.
- Versatile Excel Template: Tailored for quick edits, scenario testing, and detailed projections specific to Bentley Systems, Incorporated (BSY).
- Time-Saving and Accurate: Skip building models from scratch while ensuring precision and flexibility in your financial assessments.
Key Features
- 🔍 Real-Life BSY Financials: Pre-filled historical and projected data for Bentley Systems, Incorporated (BSY).
- ✏️ Fully Customizable Inputs: Adjust all critical parameters (yellow cells) like WACC, growth %, and tax rates.
- 📊 Professional DCF Valuation: Built-in formulas calculate Bentley’s intrinsic value using the Discounted Cash Flow method.
- ⚡ Instant Results: Visualize Bentley’s valuation instantly after making changes.
- Scenario Analysis: Test and compare outcomes for various financial assumptions side-by-side.
How It Works
- Step 1: Download the Excel file for Bentley Systems, Incorporated (BSY).
- Step 2: Review Bentley's pre-filled financial data and forecasts.
- Step 3: Modify key inputs such as revenue growth, WACC, and tax rates (highlighted cells).
- Step 4: Observe the DCF model update in real-time as you adjust your assumptions.
- Step 5: Analyze the outputs and leverage the results for your investment decisions.
Why Choose Bentley Systems, Incorporated (BSY)?
- Streamlined Processes: Effortlessly integrate advanced engineering solutions without the hassle of starting from scratch.
- Enhanced Accuracy: Benefit from precise data and algorithms that minimize errors in project planning.
- Completely Customizable: Adjust tools and features to align with your specific engineering needs and objectives.
- User-Friendly Interface: Intuitive designs and visuals simplify complex data for better decision-making.
- Endorsed by Industry Leaders: Preferred choice for professionals who prioritize accuracy and efficiency in their projects.
Who Should Use This Product?
- Investors: Accurately estimate Bentley Systems’ fair value before making investment decisions.
- CFOs: Leverage a professional-grade DCF model for financial reporting and analysis related to Bentley Systems (BSY).
- Consultants: Quickly adapt the template for valuation reports for clients interested in Bentley Systems (BSY).
- Entrepreneurs: Gain insights into financial modeling used by industry leaders like Bentley Systems (BSY).
- Educators: Use it as a teaching tool to demonstrate valuation methodologies relevant to Bentley Systems (BSY).
What the Bentley Systems Template Contains
- Comprehensive DCF Model: Editable template featuring detailed valuation calculations tailored for Bentley Systems.
- Real-World Data: Bentley Systems' historical and projected financials preloaded for in-depth analysis.
- Customizable Parameters: Modify WACC, growth rates, and tax assumptions to explore various scenarios.
- Financial Statements: Complete annual and quarterly breakdowns to provide deeper insights into financial performance.
- Key Ratios: Integrated analysis for profitability, efficiency, and leverage metrics.
- Dashboard with Visual Outputs: Engaging charts and tables that present clear, actionable results.
Disclaimer
All information, articles, and product details provided on this website are for general informational and educational purposes only. We do not claim any ownership over, nor do we intend to infringe upon, any trademarks, copyrights, logos, brand names, or other intellectual property mentioned or depicted on this site. Such intellectual property remains the property of its respective owners, and any references here are made solely for identification or informational purposes, without implying any affiliation, endorsement, or partnership.
We make no representations or warranties, express or implied, regarding the accuracy, completeness, or suitability of any content or products presented. Nothing on this website should be construed as legal, tax, investment, financial, medical, or other professional advice. In addition, no part of this site—including articles or product references—constitutes a solicitation, recommendation, endorsement, advertisement, or offer to buy or sell any securities, franchises, or other financial instruments, particularly in jurisdictions where such activity would be unlawful.
All content is of a general nature and may not address the specific circumstances of any individual or entity. It is not a substitute for professional advice or services. Any actions you take based on the information provided here are strictly at your own risk. You accept full responsibility for any decisions or outcomes arising from your use of this website and agree to release us from any liability in connection with your use of, or reliance upon, the content or products found herein.