
|
Bioxcel Therapeutics, Inc. (BTAI) DCF -Bewertung |
Fully Editable: Tailor To Your Needs In Excel Or Sheets
Professional Design: Trusted, Industry-Standard Templates
Investor-Approved Valuation Models
MAC/PC Compatible, Fully Unlocked
No Expertise Is Needed; Easy To Follow
BioXcel Therapeutics, Inc. (BTAI) Bundle
Unser DCF-Taschenrechner von Bioxcel Therapeutics, Inc. (BTAI), der für die Genauigkeit entwickelt wurde, ermöglicht es Ihnen, die Bewertung von Bioxcel Therapeutics, Inc. mit aktuellen Finanzdaten und vollständiger Flexibilität zu bewerten, um alle wesentlichen Parameter für verbesserte Projektionen zu ändern.
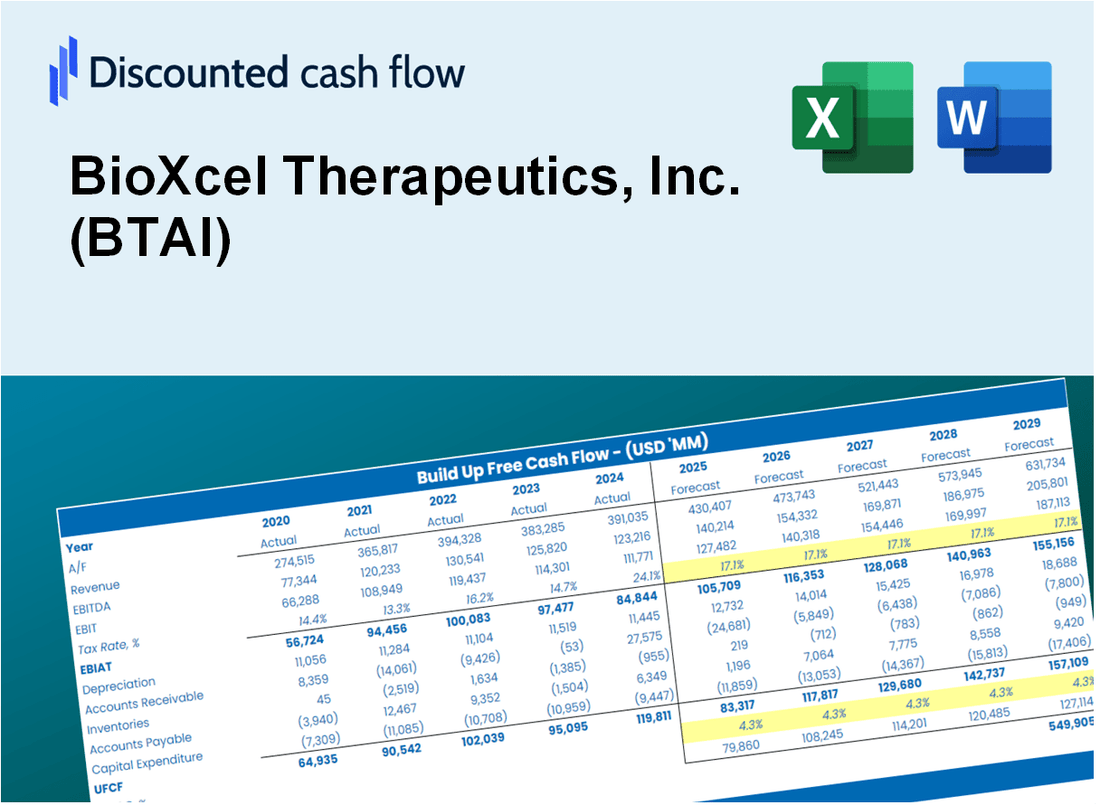
Discounted Cash Flow (DCF) - (USD MM)
| Year | AY1 2020 |
AY2 2021 |
AY3 2022 |
AY4 2023 |
AY5 2024 |
FY1 2025 |
FY2 2026 |
FY3 2027 |
FY4 2028 |
FY5 2029 |
|---|---|---|---|---|---|---|---|---|---|---|
| Revenue | .0 | .0 | .4 | 1.4 | 2.3 | 3.2 | 4.5 | 6.4 | 9.0 | 12.7 |
| Revenue Growth, % | 0 | 0 | 0 | 268 | 64.2 | 41.05 | 41.05 | 41.05 | 41.05 | 41.05 |
| EBITDA | -82.1 | -107.0 | -157.2 | -165.4 | -44.2 | -.6 | -.9 | -1.3 | -1.8 | -2.5 |
| EBITDA, % | 100 | 100 | -41924.53 | -11987.03 | -1948.85 | -20 | -20 | -20 | -20 | -20 |
| Depreciation | .2 | .3 | .3 | .3 | .3 | 2.1 | 2.9 | 4.1 | 5.8 | 8.2 |
| Depreciation, % | 100 | 100 | 87.2 | 23.04 | 13.64 | 64.78 | 64.78 | 64.78 | 64.78 | 64.78 |
| EBIT | -82.3 | -107.3 | -157.5 | -165.7 | -44.5 | -.6 | -.9 | -1.3 | -1.8 | -2.5 |
| EBIT, % | 100 | 100 | -42011.73 | -12010.07 | -1962.49 | -20 | -20 | -20 | -20 | -20 |
| Total Cash | 213.1 | 233.0 | 193.7 | 65.2 | 29.9 | 3.2 | 4.5 | 6.4 | 9.0 | 12.7 |
| Total Cash, percent | .0 | .0 | .1 | .0 | .0 | .0 | .0 | .0 | .0 | .0 |
| Account Receivables | .0 | .0 | .2 | .1 | .1 | 1.8 | 2.5 | 3.5 | 5.0 | 7.0 |
| Account Receivables, % | 100 | 100 | 66.13 | 5.14 | 5.78 | 55.41 | 55.41 | 55.41 | 55.41 | 55.41 |
| Inventories | .0 | .0 | 2.0 | 2.0 | .7 | 2.7 | 3.9 | 5.5 | 7.7 | 10.9 |
| Inventories, % | 100 | 100 | 529.33 | 144.28 | 29.96 | 85.99 | 85.99 | 85.99 | 85.99 | 85.99 |
| Accounts Payable | 4.0 | 4.7 | 10.2 | 13.7 | 16.0 | 3.2 | 4.5 | 6.4 | 9.0 | 12.7 |
| Accounts Payable, % | 100 | 100 | 2727.47 | 989.42 | 705.65 | 100 | 100 | 100 | 100 | 100 |
| Capital Expenditure | -.3 | -.4 | -.1 | .0 | .0 | -.2 | -.3 | -.5 | -.7 | -1.0 |
| Capital Expenditure, % | 100 | 100 | -37.07 | -1.45 | 0 | -7.7 | -7.7 | -7.7 | -7.7 | -7.7 |
| Tax Rate, % | 0 | 0 | 0 | 0 | 0 | 0 | 0 | 0 | 0 | 0 |
| EBITAT | -82.3 | -107.0 | -157.5 | -165.7 | -44.5 | -.6 | -.9 | -1.3 | -1.8 | -2.5 |
| Depreciation | ||||||||||
| Changes in Account Receivables | ||||||||||
| Changes in Inventories | ||||||||||
| Changes in Accounts Payable | ||||||||||
| Capital Expenditure | ||||||||||
| UFCF | -78.4 | -106.4 | -154.0 | -161.8 | -40.6 | -15.3 | 1.1 | 1.6 | 2.2 | 3.2 |
| WACC, % | 14.31 | 14.27 | 14.31 | 14.31 | 14.31 | 14.31 | 14.31 | 14.31 | 14.31 | 14.31 |
| PV UFCF | ||||||||||
| SUM PV UFCF | -8.5 | |||||||||
| Long Term Growth Rate, % | 2.00 | |||||||||
| Free cash flow (T + 1) | 3 | |||||||||
| Terminal Value | 26 | |||||||||
| Present Terminal Value | 13 | |||||||||
| Enterprise Value | 5 | |||||||||
| Net Debt | 73 | |||||||||
| Equity Value | -68 | |||||||||
| Diluted Shares Outstanding, MM | 3 | |||||||||
| Equity Value Per Share | -26.89 |
What You Will Get
- Real BTAI Financial Data: Pre-filled with BioXcel Therapeutics’ historical and projected data for precise analysis.
- Fully Editable Template: Modify key inputs like revenue growth, WACC, and EBITDA % with ease.
- Automatic Calculations: See BioXcel Therapeutics’ intrinsic value update instantly based on your changes.
- Professional Valuation Tool: Designed for investors, analysts, and consultants seeking accurate DCF results.
- User-Friendly Design: Simple structure and clear instructions for all experience levels.
Key Features
- Comprehensive Data: BioXcel Therapeutics' historical financial statements and pre-filled projections.
- Customizable Inputs: Adjust WACC, tax rates, revenue growth, and EBITDA margins to fit your analysis.
- Real-Time Insights: Monitor BioXcel Therapeutics' intrinsic value as it updates instantly.
- Visual Analytics: Dashboard visualizations showcase valuation outcomes and essential metrics.
- Designed for Precision: A robust tool tailored for analysts, investors, and finance professionals.
How It Works
- Step 1: Download the prebuilt Excel template featuring BioXcel Therapeutics, Inc. (BTAI) data.
- Step 2: Review the pre-filled sheets to familiarize yourself with the essential metrics.
- Step 3: Modify forecasts and assumptions in the editable yellow cells (WACC, growth, margins).
- Step 4: Immediately see the recalculated results, including BioXcel Therapeutics, Inc.'s (BTAI) intrinsic value.
- Step 5: Make well-informed investment choices or create reports based on the outputs.
Why Choose the BioXcel Therapeutics Calculator?
- Accuracy: Utilizes real BioXcel financial data for precise calculations.
- Flexibility: Allows users to easily adjust and test different input variables.
- Time-Saving: Eliminate the need to create a financial model from the ground up.
- Professional-Grade: Crafted with the expertise and standards expected by financial professionals.
- User-Friendly: Intuitive interface suitable for users with varying levels of financial knowledge.
Who Should Use BioXcel Therapeutics, Inc. (BTAI)?
- Investors: Make informed investment choices with insights from a pioneering biopharmaceutical company.
- Healthcare Analysts: Streamline your research with detailed reports on innovative therapies and market potential.
- Consultants: Easily modify data for client presentations or strategic assessments in the biotech sector.
- Biotech Enthusiasts: Expand your knowledge of cutting-edge drug development and its impact on patient care.
- Educators and Students: Utilize it as a real-world case study in biotechnology and pharmaceutical courses.
What the Template Contains
- Operating and Balance Sheet Data: Pre-filled BioXcel Therapeutics historical data and forecasts, including revenue, EBITDA, EBIT, and capital expenditures.
- WACC Calculation: A dedicated sheet for Weighted Average Cost of Capital (WACC), including parameters like Beta, risk-free rate, and share price.
- DCF Valuation (Unlevered and Levered): Editable Discounted Cash Flow models showing intrinsic value with detailed calculations.
- Financial Statements: Pre-loaded financial statements (annual and quarterly) to support analysis.
- Key Ratios: Includes profitability, leverage, and efficiency ratios for BioXcel Therapeutics, Inc. (BTAI).
- Dashboard and Charts: Visual summary of valuation outputs and assumptions to analyze results easily.
Disclaimer
All information, articles, and product details provided on this website are for general informational and educational purposes only. We do not claim any ownership over, nor do we intend to infringe upon, any trademarks, copyrights, logos, brand names, or other intellectual property mentioned or depicted on this site. Such intellectual property remains the property of its respective owners, and any references here are made solely for identification or informational purposes, without implying any affiliation, endorsement, or partnership.
We make no representations or warranties, express or implied, regarding the accuracy, completeness, or suitability of any content or products presented. Nothing on this website should be construed as legal, tax, investment, financial, medical, or other professional advice. In addition, no part of this site—including articles or product references—constitutes a solicitation, recommendation, endorsement, advertisement, or offer to buy or sell any securities, franchises, or other financial instruments, particularly in jurisdictions where such activity would be unlawful.
All content is of a general nature and may not address the specific circumstances of any individual or entity. It is not a substitute for professional advice or services. Any actions you take based on the information provided here are strictly at your own risk. You accept full responsibility for any decisions or outcomes arising from your use of this website and agree to release us from any liability in connection with your use of, or reliance upon, the content or products found herein.