
|
Big Yellow Group Plc (BYG.L) DCF -Bewertung |
Fully Editable: Tailor To Your Needs In Excel Or Sheets
Professional Design: Trusted, Industry-Standard Templates
Investor-Approved Valuation Models
MAC/PC Compatible, Fully Unlocked
No Expertise Is Needed; Easy To Follow
Big Yellow Group Plc (BYG.L) Bundle
Verbessern Sie Ihre Investitionsauswahl mit dem Big Yellow Group Plc (BYGL) DCF -Taschenrechner! Überprüfen Sie authentische Finanzdaten, passen Sie Wachstumsprojektionen und -kosten an und beobachten Sie, wie sich diese Modifikationen in Echtzeit auf den inneren Wert der Big Yellow Group Plc (BYGL) auswirken.
What You Will Receive
- Customizable Excel Template: A comprehensive Excel-based DCF Calculator featuring pre-loaded financial data for Big Yellow Group Plc (BYGL).
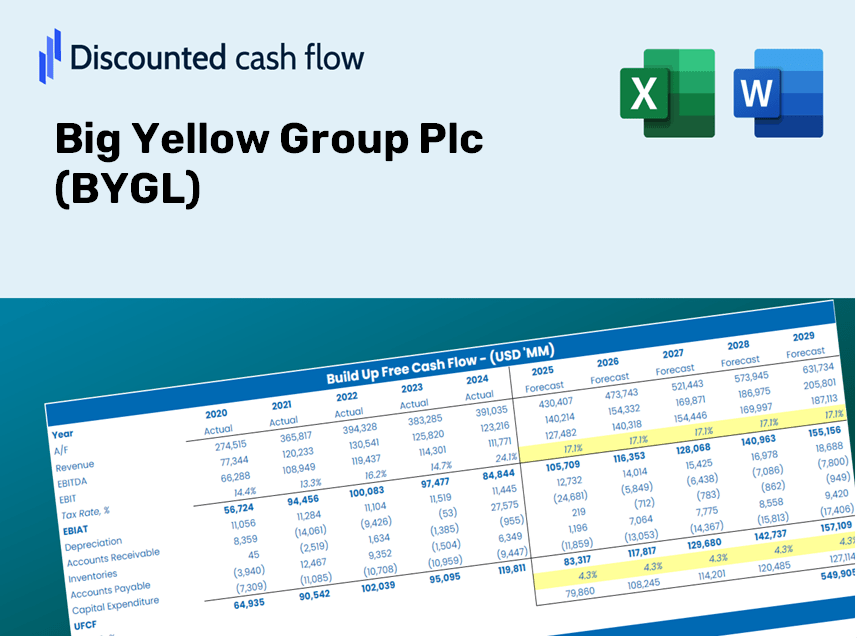
- Authentic Financial Data: Access to historical figures and future projections (highlighted in the yellow cells).
- Assumption Flexibility: Adjust key forecast parameters such as revenue growth, EBITDA margin, and WACC.
- Instant Calculations: Quickly observe how your inputs influence the valuation of Big Yellow Group Plc (BYGL).
- Professional Resource: Designed for investors, CFOs, consultants, and financial analysts.
- User-Friendly Interface: Organized for simplicity and effectiveness, complete with step-by-step guidelines.
Key Features
- Comprehensive DCF Calculator: Offers detailed unlevered and levered DCF valuation frameworks tailored for Big Yellow Group Plc (BYGL).
- WACC Calculator: Features a pre-structured Weighted Average Cost of Capital sheet with adjustable parameters.
- Customizable Forecast Assumptions: Easily alter growth rates, capital expenditures, and discount rates for accurate projections.
- Integrated Financial Ratios: Assess profitability, leverage, and efficiency ratios specifically for Big Yellow Group Plc (BYGL).
- User-Friendly Dashboard and Charts: Visual representations display essential valuation metrics for straightforward analysis.
How It Works
- Step 1: Download the Excel file.
- Step 2: Review the pre-filled data for Big Yellow Group Plc (BYGL), including historical and projected figures.
- Step 3: Modify key assumptions (highlighted in yellow cells) according to your analysis.
- Step 4: Observe the automatic recalculations for Big Yellow Group Plc’s intrinsic value.
- Step 5: Utilize the results for your investment decisions or reporting needs.
Why Choose This Calculator for Big Yellow Group Plc (BYGL)?
- Accuracy: Leverages real Big Yellow Group financial data for dependable results.
- Flexibility: Tailored for users to easily experiment and adjust inputs as needed.
- Time-Saving: Eliminate the need to create a DCF model from the ground up.
- Professional-Grade: Crafted with the precision and usability expected by finance professionals.
- User-Friendly: Intuitive interface suited for users with varying levels of financial modeling expertise.
Who Can Benefit from This Product?
- Finance Students: Master valuation techniques and apply them to real-world data.
- Researchers: Integrate professional models into your academic work or studies.
- Investors: Challenge your assumptions and evaluate valuation results for Big Yellow Group Plc (BYGL).
- Analysts: Enhance your efficiency with a customizable, ready-to-use DCF model.
- Small Business Owners: Understand how major public companies like Big Yellow Group Plc (BYGL) are assessed.
Contents of the Template
- Preloaded BYGL Data: Comprehensive historical and forecasted financial metrics, including revenue, EBIT, and capital expenditures.
- DCF and WACC Models: High-quality spreadsheets for assessing intrinsic value and calculating Weighted Average Cost of Capital.
- Editable Inputs: Cells highlighted in yellow for modifying revenue growth, tax rates, and discount rates as needed.
- Financial Statements: Detailed annual and quarterly financial reports for in-depth analysis.
- Key Ratios: Metrics related to profitability, leverage, and efficiency for performance evaluation.
- Dashboard and Charts: Visual representation of valuation results and underlying assumptions.
Disclaimer
All information, articles, and product details provided on this website are for general informational and educational purposes only. We do not claim any ownership over, nor do we intend to infringe upon, any trademarks, copyrights, logos, brand names, or other intellectual property mentioned or depicted on this site. Such intellectual property remains the property of its respective owners, and any references here are made solely for identification or informational purposes, without implying any affiliation, endorsement, or partnership.
We make no representations or warranties, express or implied, regarding the accuracy, completeness, or suitability of any content or products presented. Nothing on this website should be construed as legal, tax, investment, financial, medical, or other professional advice. In addition, no part of this site—including articles or product references—constitutes a solicitation, recommendation, endorsement, advertisement, or offer to buy or sell any securities, franchises, or other financial instruments, particularly in jurisdictions where such activity would be unlawful.
All content is of a general nature and may not address the specific circumstances of any individual or entity. It is not a substitute for professional advice or services. Any actions you take based on the information provided here are strictly at your own risk. You accept full responsibility for any decisions or outcomes arising from your use of this website and agree to release us from any liability in connection with your use of, or reliance upon, the content or products found herein.