
|
Candel Therapeutics, Inc. (CADL) DCF -Bewertung |
Fully Editable: Tailor To Your Needs In Excel Or Sheets
Professional Design: Trusted, Industry-Standard Templates
Investor-Approved Valuation Models
MAC/PC Compatible, Fully Unlocked
No Expertise Is Needed; Easy To Follow
Candel Therapeutics, Inc. (CADL) Bundle
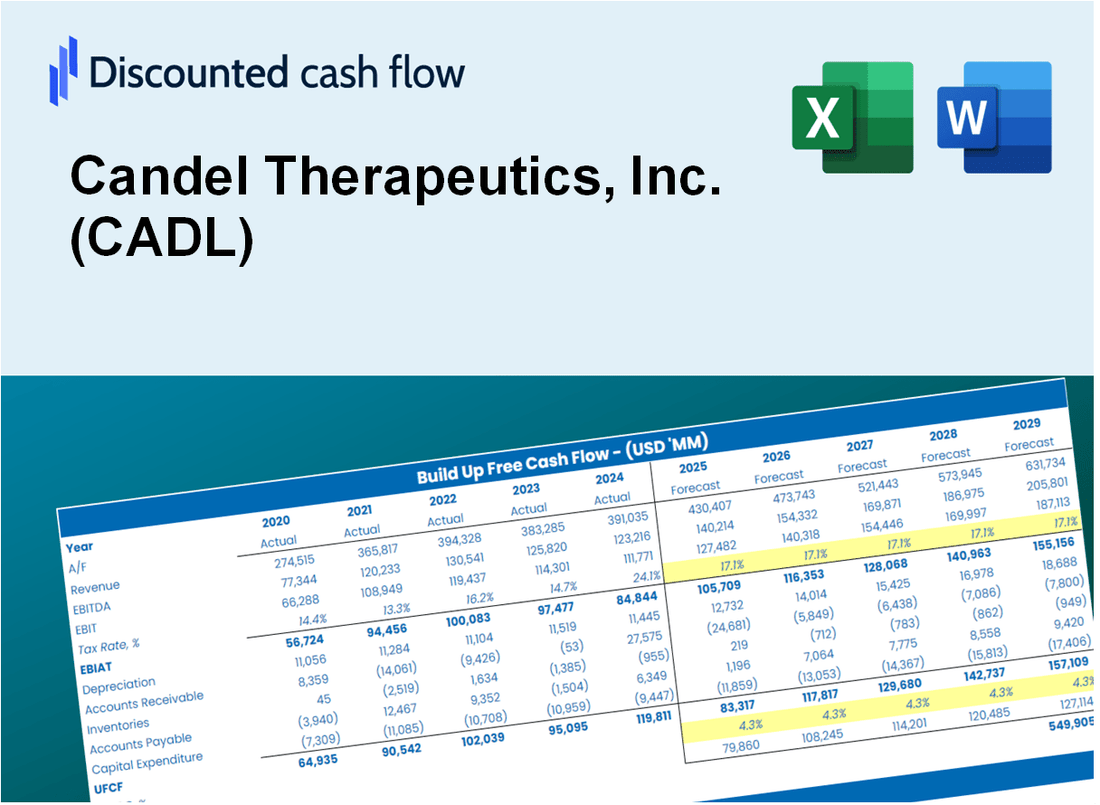
Gewinnen Sie Einblicke in die Bewertungsanalyse für Candel Therapeutics, Inc. (CADL) unter Verwendung unseres DCF-Taschenrechners des hochmodernen DCF! Diese Excel -Vorlage wird mit realen CADL -Daten vorgeladen, sodass Sie Prognosen und Annahmen anpassen können, um den inneren Wert von Candel Therapeutics, Inc. (CADL) genau zu bestimmen.
Discounted Cash Flow (DCF) - (USD MM)
| Year | AY1 2020 |
AY2 2021 |
AY3 2022 |
AY4 2023 |
AY5 2024 |
FY1 2025 |
FY2 2026 |
FY3 2027 |
FY4 2028 |
FY5 2029 |
|---|---|---|---|---|---|---|---|---|---|---|
| Revenue | .1 | .1 | .1 | .0 | .0 | .0 | .0 | .0 | .0 | .0 |
| Revenue Growth, % | 0 | 0 | 0 | -100 | 0 | -25 | -25 | -25 | -25 | -25 |
| EBITDA | -13.7 | -25.5 | -16.3 | -37.4 | -52.1 | .0 | .0 | .0 | .0 | .0 |
| EBITDA, % | -10975.2 | -20395.2 | -13046.4 | 100 | 100 | -20 | -20 | -20 | -20 | -20 |
| Depreciation | .1 | .2 | .8 | 1.0 | 1.0 | .0 | .0 | .0 | .0 | .0 |
| Depreciation, % | 72.8 | 185.6 | 622.4 | 100 | 100 | 94.56 | 94.56 | 94.56 | 94.56 | 94.56 |
| EBIT | -13.8 | -25.7 | -17.1 | -38.4 | -53.1 | .0 | .0 | .0 | .0 | .0 |
| EBIT, % | -11048 | -20580.8 | -13668.8 | 100 | 100 | -20 | -20 | -20 | -20 | -20 |
| Total Cash | 35.1 | 82.6 | 70.1 | 35.4 | 102.7 | .0 | .0 | .0 | .0 | .0 |
| Total Cash, percent | .0 | .1 | .1 | .0 | .0 | .0 | .0 | .0 | .0 | .0 |
| Account Receivables | .0 | .0 | .0 | .0 | .0 | .0 | .0 | .0 | .0 | .0 |
| Account Receivables, % | 0 | 0 | 0 | 100 | 100 | 40 | 40 | 40 | 40 | 40 |
| Inventories | .0 | .0 | .0 | .0 | .0 | .0 | .0 | .0 | .0 | .0 |
| Inventories, % | 0 | 0 | 0 | 100 | 100 | 40 | 40 | 40 | 40 | 40 |
| Accounts Payable | .9 | 1.6 | .4 | .4 | .2 | .0 | .0 | .0 | .0 | .0 |
| Accounts Payable, % | 736.8 | 1272 | 304 | 100 | 100 | 100 | 100 | 100 | 100 | 100 |
| Capital Expenditure | -1.5 | -1.8 | -1.3 | -.5 | .0 | .0 | .0 | .0 | .0 | .0 |
| Capital Expenditure, % | -1180.8 | -1468 | -1037.6 | 100 | 100 | -60 | -60 | -60 | -60 | -60 |
| Tax Rate, % | 0 | 0 | 0 | 0 | 0 | 0 | 0 | 0 | 0 | 0 |
| EBITAT | -13.8 | -25.7 | -17.1 | -38.4 | -53.1 | .0 | .0 | .0 | .0 | .0 |
| Depreciation | ||||||||||
| Changes in Account Receivables | ||||||||||
| Changes in Inventories | ||||||||||
| Changes in Accounts Payable | ||||||||||
| Capital Expenditure | ||||||||||
| UFCF | -14.3 | -26.7 | -18.8 | -37.8 | -52.3 | -.2 | .0 | .0 | .0 | .0 |
| WACC, % | 5.59 | 5.59 | 5.59 | 5.59 | 5.59 | 5.59 | 5.59 | 5.59 | 5.59 | 5.59 |
| PV UFCF | ||||||||||
| SUM PV UFCF | -.2 | |||||||||
| Long Term Growth Rate, % | 2.00 | |||||||||
| Free cash flow (T + 1) | 0 | |||||||||
| Terminal Value | 0 | |||||||||
| Present Terminal Value | 0 | |||||||||
| Enterprise Value | 0 | |||||||||
| Net Debt | -89 | |||||||||
| Equity Value | 89 | |||||||||
| Diluted Shares Outstanding, MM | 32 | |||||||||
| Equity Value Per Share | 2.81 |
What You Will Get
- Real Candel Data: Preloaded financials – from revenue to EBIT – based on actual and projected figures for Candel Therapeutics, Inc. (CADL).
- Full Customization: Adjust all critical parameters (yellow cells) such as WACC, growth %, and tax rates to fit your analysis needs.
- Instant Valuation Updates: Automatic recalculations to evaluate the impact of changes on Candel Therapeutics’ fair value.
- Versatile Excel Template: Designed for quick edits, scenario testing, and comprehensive projections specific to Candel Therapeutics, Inc. (CADL).
- Time-Saving and Accurate: Avoid building models from scratch while ensuring precision and flexibility in your financial assessments.
Key Features
- Comprehensive Clinical Data: Access detailed pre-loaded historical clinical trial results and future development projections for Candel Therapeutics, Inc. (CADL).
- Adjustable Research Parameters: Modify highlighted fields to tailor assumptions like discount rates, growth expectations, and operational margins.
- Real-Time Analytics: Instant updates to valuation models, Net Present Value (NPV), and revenue forecasts based on the latest data.
- Interactive Visualization Tools: User-friendly graphs and summaries to effectively communicate your investment analysis.
- Designed for All Experience Levels: An accessible layout suitable for investors, analysts, and healthcare consultants alike.
How It Works
- Step 1: Download the prebuilt Excel template featuring Candel Therapeutics' data.
- Step 2: Navigate through the pre-filled sheets to familiarize yourself with the essential metrics.
- Step 3: Update forecasts and assumptions in the editable yellow cells (WACC, growth, margins).
- Step 4: Instantly view recalculated results, including Candel Therapeutics' intrinsic value.
- Step 5: Make informed investment decisions or generate reports based on the outputs.
Why Choose This Calculator for Candel Therapeutics, Inc. (CADL)?
- Accurate Data: Real Candel Therapeutics financials ensure reliable valuation results.
- Customizable: Adjust key parameters like growth rates, WACC, and tax rates to align with your projections.
- Time-Saving: Pre-built calculations streamline your analysis and save time.
- Professional-Grade Tool: Tailored for investors, analysts, and industry consultants.
- User-Friendly: Intuitive design and clear instructions make it accessible for all users.
Who Should Use Candel Therapeutics, Inc. (CADL)?
- Investors: Make informed decisions with insights from a leading biotech company focused on innovative therapies.
- Healthcare Analysts: Streamline your research with comprehensive data on cutting-edge therapeutic development.
- Consultants: Efficiently tailor presentations and reports using Candel's latest advancements and research findings.
- Biotech Enthusiasts: Enhance your knowledge of the biopharmaceutical landscape through Candel's pioneering approaches.
- Educators and Students: Utilize Candel’s developments as a case study in biotechnology and pharmaceutical courses.
What the Template Contains
- Operating and Balance Sheet Data: Pre-filled Candel Therapeutics, Inc. (CADL) historical data and forecasts, including revenue, EBITDA, EBIT, and capital expenditures.
- WACC Calculation: A dedicated sheet for Weighted Average Cost of Capital (WACC), including parameters like Beta, risk-free rate, and share price.
- DCF Valuation (Unlevered and Levered): Editable Discounted Cash Flow models showing intrinsic value with detailed calculations.
- Financial Statements: Pre-loaded financial statements (annual and quarterly) to support analysis.
- Key Ratios: Includes profitability, leverage, and efficiency ratios for Candel Therapeutics, Inc. (CADL).
- Dashboard and Charts: Visual summary of valuation outputs and assumptions to analyze results easily.
Disclaimer
All information, articles, and product details provided on this website are for general informational and educational purposes only. We do not claim any ownership over, nor do we intend to infringe upon, any trademarks, copyrights, logos, brand names, or other intellectual property mentioned or depicted on this site. Such intellectual property remains the property of its respective owners, and any references here are made solely for identification or informational purposes, without implying any affiliation, endorsement, or partnership.
We make no representations or warranties, express or implied, regarding the accuracy, completeness, or suitability of any content or products presented. Nothing on this website should be construed as legal, tax, investment, financial, medical, or other professional advice. In addition, no part of this site—including articles or product references—constitutes a solicitation, recommendation, endorsement, advertisement, or offer to buy or sell any securities, franchises, or other financial instruments, particularly in jurisdictions where such activity would be unlawful.
All content is of a general nature and may not address the specific circumstances of any individual or entity. It is not a substitute for professional advice or services. Any actions you take based on the information provided here are strictly at your own risk. You accept full responsibility for any decisions or outcomes arising from your use of this website and agree to release us from any liability in connection with your use of, or reliance upon, the content or products found herein.