
|
Cal-Maine Foods, Inc. (Ruhe) DCF-Bewertung |
Fully Editable: Tailor To Your Needs In Excel Or Sheets
Professional Design: Trusted, Industry-Standard Templates
Investor-Approved Valuation Models
MAC/PC Compatible, Fully Unlocked
No Expertise Is Needed; Easy To Follow
Cal-Maine Foods, Inc. (CALM) Bundle
Streamline Cal-Maine Foods, Inc. (Calm) Bewertung mit diesem anpassbaren DCF-Taschenrechner! Ausgestattet mit Real Cal-Maine Foods, Inc. (Calm) Financials und einstellbaren prognostizierten Inputs können Sie verschiedene Szenarien untersuchen und in nur wenigen Minuten den fairen Wert von Cal-Maine Foods, Inc. (ruhig) ermitteln.
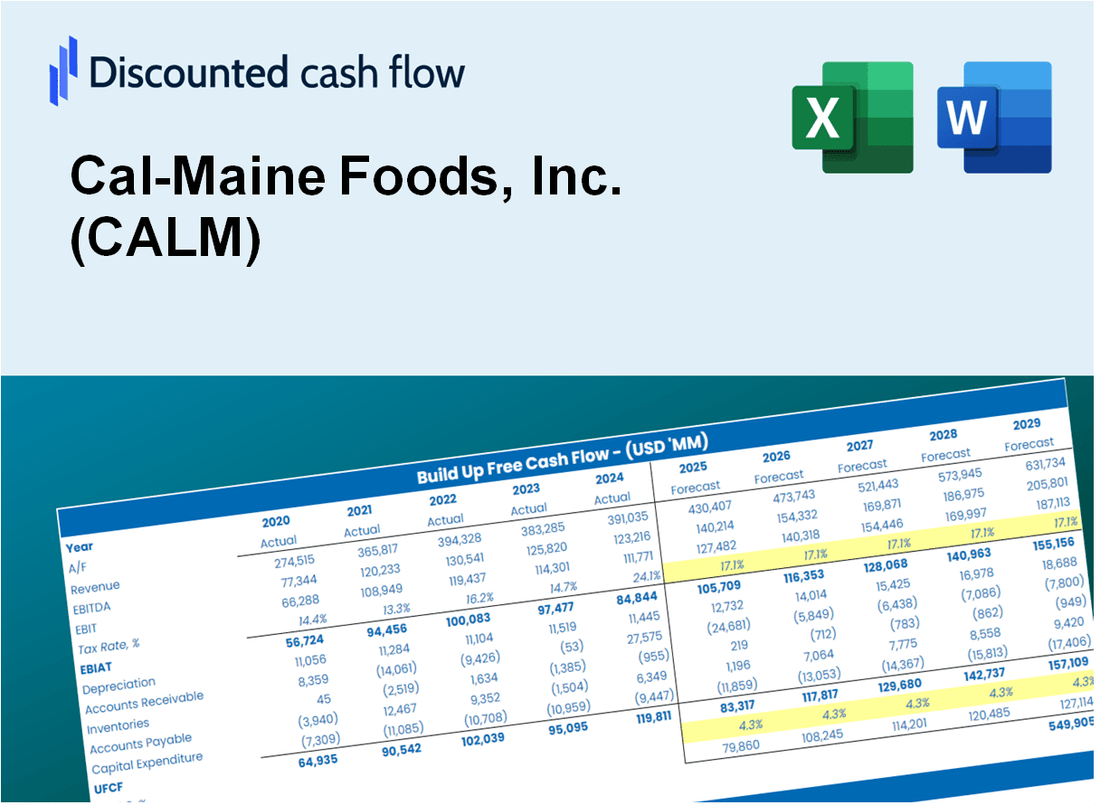
Discounted Cash Flow (DCF) - (USD MM)
| Year | AY1 2021 |
AY2 2022 |
AY3 2023 |
AY4 2024 |
AY5 2025 |
FY1 2026 |
FY2 2027 |
FY3 2028 |
FY4 2029 |
FY5 2030 |
|---|---|---|---|---|---|---|---|---|---|---|
| Revenue | 1,349.0 | 1,777.2 | 3,146.2 | 2,326.4 | 4,261.9 | 3,984.4 | 3,724.9 | 3,482.3 | 3,255.6 | 3,043.6 |
| Revenue Growth, % | 0 | 31.74 | 77.04 | -26.06 | 83.19 | -6.51 | -6.51 | -6.51 | -6.51 | -6.51 |
| EBITDA | 49.7 | 234.8 | 1,071.4 | 440.8 | 1,697.8 | 874.4 | 817.5 | 764.3 | 714.5 | 668.0 |
| EBITDA, % | 3.69 | 13.21 | 34.05 | 18.95 | 39.84 | 21.95 | 21.95 | 21.95 | 21.95 | 21.95 |
| Depreciation | 59.5 | 68.4 | 72.2 | 80.2 | 94.0 | 129.2 | 120.8 | 112.9 | 105.5 | 98.7 |
| Depreciation, % | 4.41 | 3.85 | 2.3 | 3.45 | 2.21 | 3.24 | 3.24 | 3.24 | 3.24 | 3.24 |
| EBIT | -9.7 | 166.4 | 999.1 | 360.5 | 1,603.8 | 745.3 | 696.7 | 651.4 | 609.0 | 569.3 |
| EBIT, % | -0.72173 | 9.36 | 31.76 | 15.5 | 37.63 | 18.71 | 18.71 | 18.71 | 18.71 | 18.71 |
| Total Cash | 169.5 | 174.5 | 647.9 | 812.4 | 1,393.1 | 881.2 | 823.8 | 770.2 | 720.0 | 673.1 |
| Total Cash, percent | .0 | .0 | .0 | .0 | .0 | .0 | .0 | .0 | .0 | .0 |
| Account Receivables | 126.6 | 219.4 | 187.2 | 162.4 | 272.4 | 327.2 | 305.9 | 285.9 | 267.3 | 249.9 |
| Account Receivables, % | 9.39 | 12.35 | 5.95 | 6.98 | 6.39 | 8.21 | 8.21 | 8.21 | 8.21 | 8.21 |
| Inventories | 218.4 | 263.3 | 284.4 | 261.8 | 295.7 | 464.1 | 433.8 | 405.6 | 379.2 | 354.5 |
| Inventories, % | 16.19 | 14.82 | 9.04 | 11.25 | 6.94 | 11.65 | 11.65 | 11.65 | 11.65 | 11.65 |
| Accounts Payable | 52.8 | 82.0 | 82.6 | 75.9 | 101.0 | 133.8 | 125.1 | 116.9 | 109.3 | 102.2 |
| Accounts Payable, % | 3.91 | 4.62 | 2.63 | 3.26 | 2.37 | 3.36 | 3.36 | 3.36 | 3.36 | 3.36 |
| Capital Expenditure | -95.1 | -72.4 | -136.6 | -147.1 | -161.3 | -203.8 | -190.5 | -178.1 | -166.5 | -155.6 |
| Capital Expenditure, % | -7.05 | -4.07 | -4.34 | -6.32 | -3.78 | -5.11 | -5.11 | -5.11 | -5.11 | -5.11 |
| Tax Rate, % | 23.9 | 23.9 | 23.9 | 23.9 | 23.9 | 23.9 | 23.9 | 23.9 | 23.9 | 23.9 |
| EBITAT | 2.0 | 133.0 | 758.5 | 278.3 | 1,220.5 | 460.8 | 430.8 | 402.7 | 376.5 | 352.0 |
| Depreciation | ||||||||||
| Changes in Account Receivables | ||||||||||
| Changes in Inventories | ||||||||||
| Changes in Accounts Payable | ||||||||||
| Capital Expenditure | ||||||||||
| UFCF | -325.8 | 20.5 | 705.8 | 252.1 | 1,034.6 | 195.7 | 403.8 | 377.5 | 352.9 | 330.0 |
| WACC, % | 4.76 | 4.76 | 4.76 | 4.76 | 4.76 | 4.76 | 4.76 | 4.76 | 4.76 | 4.76 |
| PV UFCF | ||||||||||
| SUM PV UFCF | 1,437.7 | |||||||||
| Long Term Growth Rate, % | 0.50 | |||||||||
| Free cash flow (T + 1) | 332 | |||||||||
| Terminal Value | 7,785 | |||||||||
| Present Terminal Value | 6,170 | |||||||||
| Enterprise Value | 7,608 | |||||||||
| Net Debt | -500 | |||||||||
| Equity Value | 8,108 | |||||||||
| Diluted Shares Outstanding, MM | 49 | |||||||||
| Equity Value Per Share | 165.85 |
What You Will Get
- Editable Forecast Inputs: Easily modify key assumptions (growth %, margins, WACC) to explore various scenarios.
- Real-World Data: Cal-Maine Foods, Inc.'s (CALM) financial data pre-loaded to facilitate your analysis.
- Automatic DCF Outputs: The template computes Net Present Value (NPV) and intrinsic value automatically.
- Customizable and Professional: A refined Excel model tailored to meet your valuation requirements.
- Built for Analysts and Investors: Perfect for evaluating projections, validating strategies, and enhancing efficiency.
Key Features
- 🔍 Real-Life CALM Financials: Pre-filled historical and projected data for Cal-Maine Foods, Inc. (CALM).
- ✏️ Fully Customizable Inputs: Adjust all critical parameters (yellow cells) like WACC, growth %, and tax rates.
- 📊 Professional DCF Valuation: Built-in formulas calculate Cal-Maine's intrinsic value using the Discounted Cash Flow method.
- ⚡ Instant Results: Visualize Cal-Maine's valuation instantly after making changes.
- Scenario Analysis: Test and compare outcomes for various financial assumptions side-by-side.
How It Works
- Step 1: Download the Excel file.
- Step 2: Review pre-entered Cal-Maine Foods data (historical and projected).
- Step 3: Adjust key assumptions (yellow cells) based on your analysis.
- Step 4: View automatic recalculations for Cal-Maine Foods' intrinsic value.
- Step 5: Use the outputs for investment decisions or reporting.
Why Choose This Calculator for Cal-Maine Foods, Inc. (CALM)?
- User-Friendly Interface: Perfectly crafted for both novice users and seasoned professionals.
- Customizable Inputs: Adjust parameters easily to suit your financial analysis.
- Real-Time Adjustments: Observe immediate updates to Cal-Maine's valuation as you tweak inputs.
- Preloaded Data: Comes equipped with Cal-Maine's latest financial figures for swift evaluations.
- Relied Upon by Experts: A go-to tool for investors and analysts seeking to make informed choices.
Who Should Use This Product?
- Investors: Accurately assess Cal-Maine Foods' fair value before making investment choices.
- CFOs: Utilize a professional-grade DCF model for financial reporting and analysis specific to Cal-Maine Foods (CALM).
- Consultants: Easily customize the template for valuation reports tailored to clients in the food industry.
- Entrepreneurs: Acquire knowledge on financial modeling practices utilized by leading companies like Cal-Maine Foods (CALM).
- Educators: Employ it as a teaching resource to illustrate valuation methodologies relevant to the agricultural sector.
What the Template Contains
- Pre-Filled Data: Includes Cal-Maine Foods, Inc. (CALM) historical financials and forecasts.
- Discounted Cash Flow Model: Editable DCF valuation model with automatic calculations.
- Weighted Average Cost of Capital (WACC): A dedicated sheet for calculating WACC based on custom inputs.
- Key Financial Ratios: Analyze Cal-Maine Foods, Inc. (CALM) profitability, efficiency, and leverage.
- Customizable Inputs: Edit revenue growth, margins, and tax rates with ease.
- Clear Dashboard: Charts and tables summarizing key valuation results.
Disclaimer
All information, articles, and product details provided on this website are for general informational and educational purposes only. We do not claim any ownership over, nor do we intend to infringe upon, any trademarks, copyrights, logos, brand names, or other intellectual property mentioned or depicted on this site. Such intellectual property remains the property of its respective owners, and any references here are made solely for identification or informational purposes, without implying any affiliation, endorsement, or partnership.
We make no representations or warranties, express or implied, regarding the accuracy, completeness, or suitability of any content or products presented. Nothing on this website should be construed as legal, tax, investment, financial, medical, or other professional advice. In addition, no part of this site—including articles or product references—constitutes a solicitation, recommendation, endorsement, advertisement, or offer to buy or sell any securities, franchises, or other financial instruments, particularly in jurisdictions where such activity would be unlawful.
All content is of a general nature and may not address the specific circumstances of any individual or entity. It is not a substitute for professional advice or services. Any actions you take based on the information provided here are strictly at your own risk. You accept full responsibility for any decisions or outcomes arising from your use of this website and agree to release us from any liability in connection with your use of, or reliance upon, the content or products found herein.