
|
Carrier Global Corporation (CARR) DCF -Bewertung |
Fully Editable: Tailor To Your Needs In Excel Or Sheets
Professional Design: Trusted, Industry-Standard Templates
Investor-Approved Valuation Models
MAC/PC Compatible, Fully Unlocked
No Expertise Is Needed; Easy To Follow
Carrier Global Corporation (CARR) Bundle
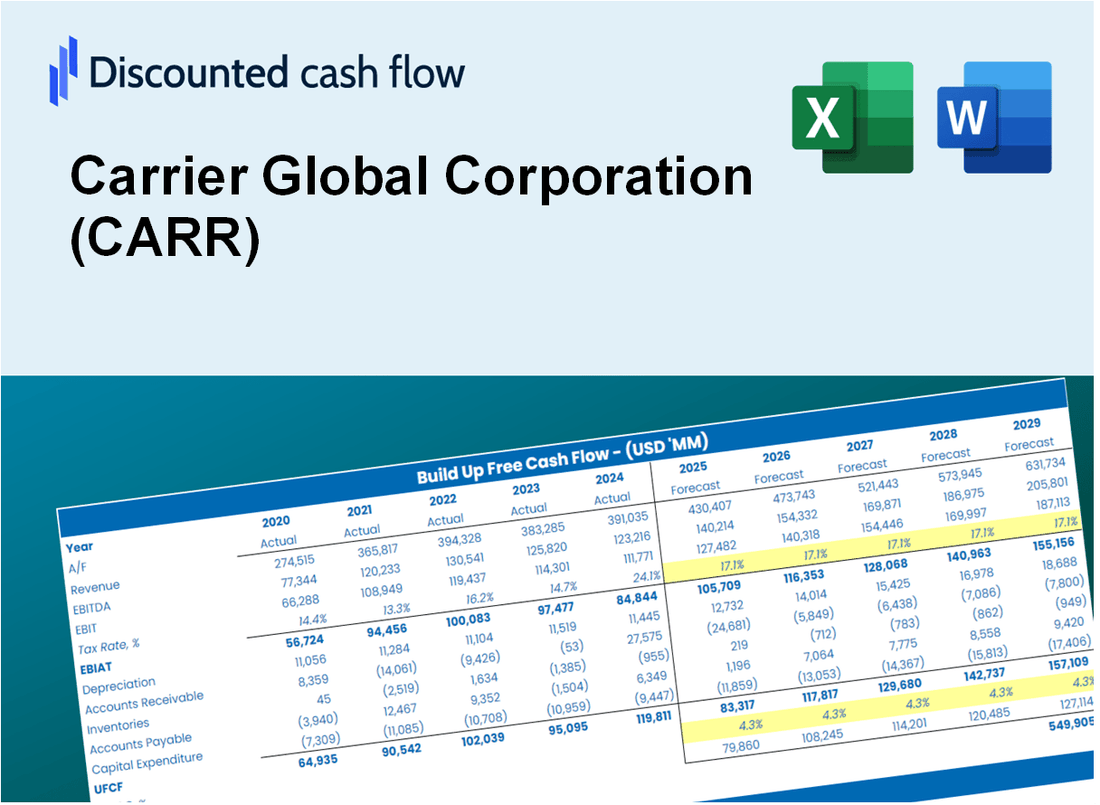
Bewerten Sie die finanziellen Aussichten der Carrier Global Corporation wie ein Experte! Dieser (CARR) DCF-Taschenrechner bietet Ihnen vorgefüllte Finanzdaten und die Flexibilität, das Umsatzwachstum, WACC, Margen und andere wichtige Annahmen zu ändern, um sich an Ihren Projektionen anzupassen.
What You Will Get
- Real Carrier Data: Preloaded financials – from revenue to EBIT – based on actual and projected figures.
- Full Customization: Adjust all critical parameters (yellow cells) like WACC, growth %, and tax rates.
- Instant Valuation Updates: Automatic recalculations to analyze the impact of changes on Carrier’s fair value.
- Versatile Excel Template: Tailored for quick edits, scenario testing, and detailed projections.
- Time-Saving and Accurate: Skip building models from scratch while maintaining precision and flexibility.
Key Features
- 🔍 Real-Life CARR Financials: Pre-filled historical and projected data for Carrier Global Corporation (CARR).
- ✏️ Fully Customizable Inputs: Adjust all critical parameters (yellow cells) like WACC, growth %, and tax rates.
- 📊 Professional DCF Valuation: Built-in formulas calculate Carrier's intrinsic value using the Discounted Cash Flow method.
- ⚡ Instant Results: Visualize Carrier's valuation instantly after making changes.
- Scenario Analysis: Test and compare outcomes for various financial assumptions side-by-side.
How It Works
- Download the Template: Gain immediate access to the Excel-based CARR DCF Calculator.
- Input Your Assumptions: Modify the yellow-highlighted cells for growth rates, WACC, margins, and additional parameters.
- Instant Calculations: The model automatically recalculates Carrier Global Corporation’s intrinsic value.
- Test Scenarios: Experiment with different assumptions to assess potential valuation variations.
- Analyze and Decide: Utilize the findings to inform your investment or financial analysis.
Why Choose This Calculator for Carrier Global Corporation (CARR)?
- Accuracy: Utilizes real Carrier financials for precise data.
- Flexibility: Allows users to easily test and adjust inputs as needed.
- Time-Saving: Eliminate the need to create a DCF model from the ground up.
- Professional-Grade: Crafted with the precision and usability expected at the CFO level.
- User-Friendly: Intuitive interface suitable for users without extensive financial modeling knowledge.
Who Should Use Carrier Global Corporation (CARR) Products?
- Investors: Make informed investment choices with industry-leading HVAC solutions.
- Facility Managers: Enhance operational efficiency with advanced building management systems.
- Contractors: Easily integrate Carrier products into your projects for optimal performance.
- Homeowners: Improve comfort and energy efficiency with smart heating and cooling systems.
- Students and Educators: Utilize Carrier's resources to explore innovative technologies in HVAC education.
What the Template Contains
- Historical Data: Includes Carrier Global Corporation’s past financials and baseline forecasts.
- DCF and Levered DCF Models: Detailed templates to calculate Carrier Global Corporation’s intrinsic value.
- WACC Sheet: Pre-built calculations for Weighted Average Cost of Capital.
- Editable Inputs: Modify key drivers like growth rates, EBITDA %, and CAPEX assumptions.
- Quarterly and Annual Statements: A complete breakdown of Carrier Global Corporation’s financials.
- Interactive Dashboard: Visualize valuation results and projections dynamically.
Disclaimer
All information, articles, and product details provided on this website are for general informational and educational purposes only. We do not claim any ownership over, nor do we intend to infringe upon, any trademarks, copyrights, logos, brand names, or other intellectual property mentioned or depicted on this site. Such intellectual property remains the property of its respective owners, and any references here are made solely for identification or informational purposes, without implying any affiliation, endorsement, or partnership.
We make no representations or warranties, express or implied, regarding the accuracy, completeness, or suitability of any content or products presented. Nothing on this website should be construed as legal, tax, investment, financial, medical, or other professional advice. In addition, no part of this site—including articles or product references—constitutes a solicitation, recommendation, endorsement, advertisement, or offer to buy or sell any securities, franchises, or other financial instruments, particularly in jurisdictions where such activity would be unlawful.
All content is of a general nature and may not address the specific circumstances of any individual or entity. It is not a substitute for professional advice or services. Any actions you take based on the information provided here are strictly at your own risk. You accept full responsibility for any decisions or outcomes arising from your use of this website and agree to release us from any liability in connection with your use of, or reliance upon, the content or products found herein.