
|
Avid BioServices, Inc. (CDMO) DCF -Bewertung |
Fully Editable: Tailor To Your Needs In Excel Or Sheets
Professional Design: Trusted, Industry-Standard Templates
Investor-Approved Valuation Models
MAC/PC Compatible, Fully Unlocked
No Expertise Is Needed; Easy To Follow
Avid Bioservices, Inc. (CDMO) Bundle
Bewerten Sie die finanziellen Aussichten von Avid BioServices, Inc. wie ein Experte! Dieser (CDMO) DCF-Taschenrechner bietet Ihnen vorgefüllte Finanzdaten und ermöglicht Ihnen die Flexibilität, das Umsatzwachstum, WACC, Margen und andere kritische Annahmen zu ändern, um sich mit Ihren Vorhersagen auszurichten.
What You Will Receive
- Comprehensive Financial Model: Avid Bioservices' actual data supports accurate DCF valuation.
- Complete Forecast Flexibility: Modify revenue growth, profit margins, WACC, and other essential factors.
- Real-Time Calculations: Automatic updates provide immediate feedback as you adjust inputs.
- Professional-Grade Template: A polished Excel file crafted for high-quality valuation presentations.
- Adaptable and Repeatable: Designed for versatility, allowing for ongoing use in detailed forecasting.
Key Features
- Comprehensive Data: Avid Bioservices’ historical financial statements and pre-filled forecasts.
- Customizable Inputs: Adjust WACC, tax rates, revenue growth, and EBITDA margins as needed.
- Real-Time Insights: Monitor Avid Bioservices’ intrinsic value recalculating instantly.
- Intuitive Visual Outputs: Dashboard charts present valuation results and essential metrics clearly.
- Designed for Precision: A professional-grade tool for analysts, investors, and finance professionals.
How It Works
- Download: Obtain the ready-to-use Excel file containing Avid Bioservices, Inc.'s (CDMO) financial data.
- Customize: Tailor your forecasts, including revenue growth, EBITDA %, and WACC specifics.
- Update Automatically: Watch as the intrinsic value and NPV calculations refresh in real-time.
- Test Scenarios: Generate various projections and compare results instantly.
- Make Decisions: Leverage the valuation findings to inform your investment strategy.
Why Choose This Calculator?
- User-Friendly Interface: Perfect for both newcomers and seasoned professionals.
- Customizable Inputs: Easily adjust parameters to tailor your analysis.
- Real-Time Feedback: Watch Avid Bioservices, Inc. (CDMO) valuation change instantly as you modify inputs.
- Preloaded Data: Comes with Avid Bioservices, Inc. (CDMO) actual financial metrics for efficient analysis.
- Widely Recognized: Valued by investors and analysts for making strategic decisions.
Who Should Use This Product?
- Biotech Investors: Gain insights for making informed decisions regarding investments in Avid Bioservices, Inc. (CDMO).
- Financial Analysts: Enhance your analysis with comprehensive financial models tailored for Avid Bioservices, Inc. (CDMO).
- Consultants: Provide clients with accurate and timely valuation assessments of Avid Bioservices, Inc. (CDMO).
- Pharmaceutical Entrepreneurs: Learn how companies like Avid Bioservices, Inc. (CDMO) are valued to shape your business strategy.
- Life Sciences Students: Explore valuation methodologies using real-world examples from Avid Bioservices, Inc. (CDMO).
What the Template Contains
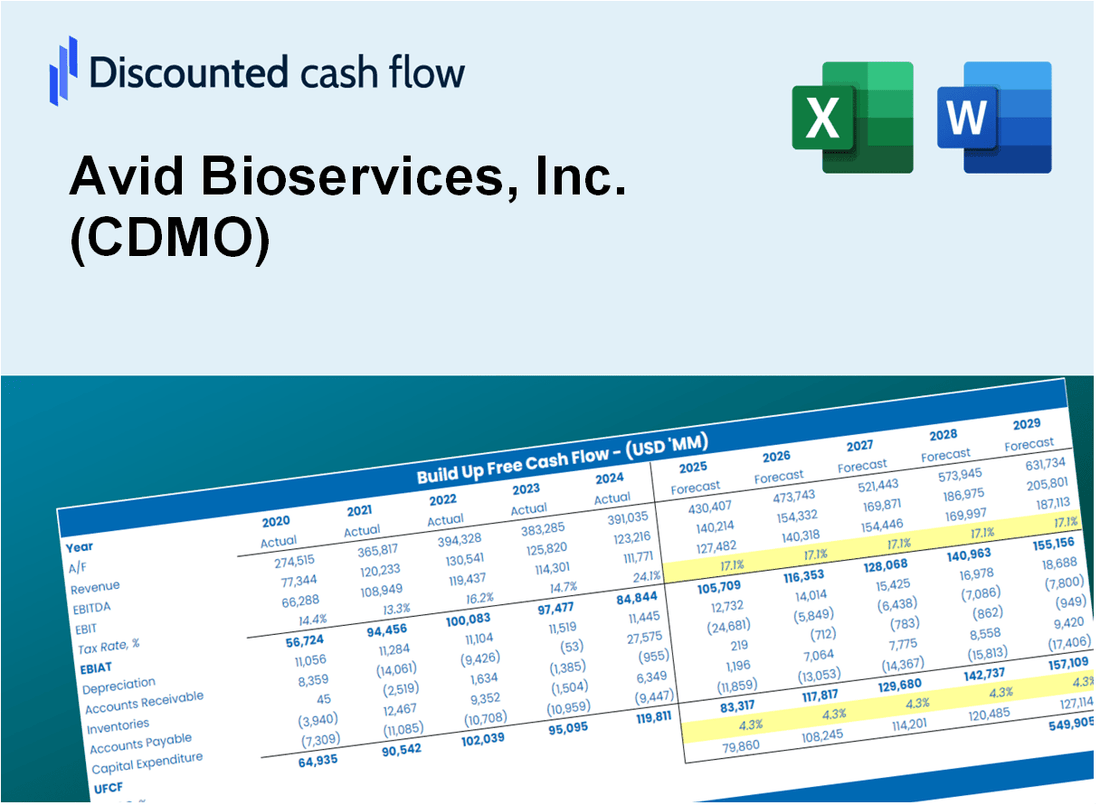
- Operating and Balance Sheet Data: Pre-filled Avid Bioservices, Inc. (CDMO) historical data and forecasts, including revenue, EBITDA, EBIT, and capital expenditures.
- WACC Calculation: A dedicated sheet for Weighted Average Cost of Capital (WACC), including parameters like Beta, risk-free rate, and share price.
- DCF Valuation (Unlevered and Levered): Editable Discounted Cash Flow models showing intrinsic value with detailed calculations.
- Financial Statements: Pre-loaded financial statements (annual and quarterly) to support analysis.
- Key Ratios: Includes profitability, leverage, and efficiency ratios for Avid Bioservices, Inc. (CDMO).
- Dashboard and Charts: Visual summary of valuation outputs and assumptions to analyze results easily.
Disclaimer
All information, articles, and product details provided on this website are for general informational and educational purposes only. We do not claim any ownership over, nor do we intend to infringe upon, any trademarks, copyrights, logos, brand names, or other intellectual property mentioned or depicted on this site. Such intellectual property remains the property of its respective owners, and any references here are made solely for identification or informational purposes, without implying any affiliation, endorsement, or partnership.
We make no representations or warranties, express or implied, regarding the accuracy, completeness, or suitability of any content or products presented. Nothing on this website should be construed as legal, tax, investment, financial, medical, or other professional advice. In addition, no part of this site—including articles or product references—constitutes a solicitation, recommendation, endorsement, advertisement, or offer to buy or sell any securities, franchises, or other financial instruments, particularly in jurisdictions where such activity would be unlawful.
All content is of a general nature and may not address the specific circumstances of any individual or entity. It is not a substitute for professional advice or services. Any actions you take based on the information provided here are strictly at your own risk. You accept full responsibility for any decisions or outcomes arising from your use of this website and agree to release us from any liability in connection with your use of, or reliance upon, the content or products found herein.