
|
Capri Global Capital Limited (CGCL.NS) DCF -Bewertung |
Fully Editable: Tailor To Your Needs In Excel Or Sheets
Professional Design: Trusted, Industry-Standard Templates
Investor-Approved Valuation Models
MAC/PC Compatible, Fully Unlocked
No Expertise Is Needed; Easy To Follow
Capri Global Capital Limited (CGCL.NS) Bundle
Entdecken Sie die finanziellen Aussichten von Capri Global Capital Limited (CGCLNs) mit unserem benutzerfreundlichen DCF-Taschenrechner! Geben Sie Ihre Annahmen für Wachstum, Margen und Ausgaben ein, um den inneren Wert von Capri Global Capital Limited (CGCLNs) zu berechnen und formen Sie Ihren Investitionsansatz.
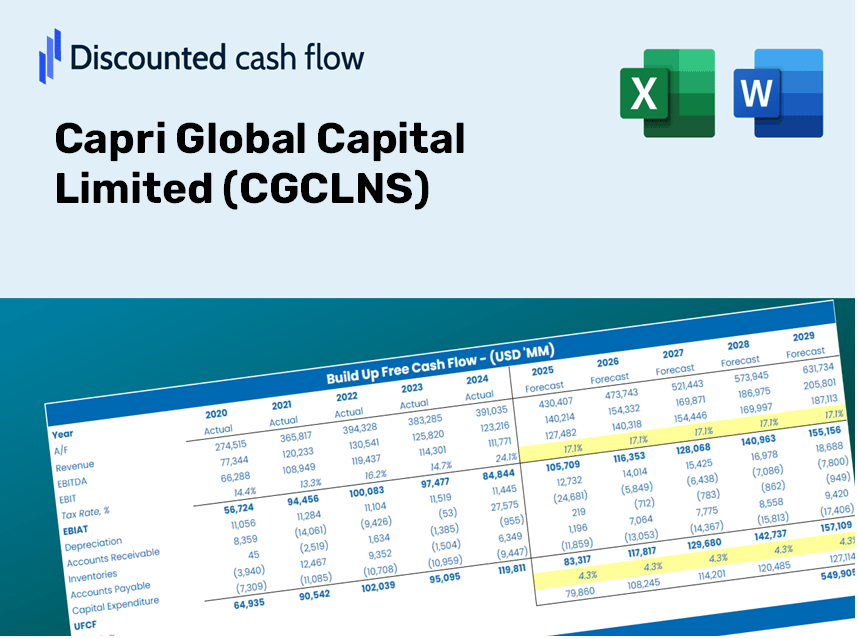
Discounted Cash Flow (DCF) - (USD MM)
| Year | AY1 2021 |
AY2 2022 |
AY3 2023 |
AY4 2024 |
AY5 2025 |
FY1 2026 |
FY2 2027 |
FY3 2028 |
FY4 2029 |
FY5 2030 |
|---|---|---|---|---|---|---|---|---|---|---|
| Revenue | 7,362.1 | 9,807.4 | 14,651.2 | 23,136.3 | 32,508.4 | 47,220.6 | 68,591.1 | 99,633.2 | 144,723.9 | 210,221.2 |
| Revenue Growth, % | 0 | 33.22 | 49.39 | 57.91 | 40.51 | 45.26 | 45.26 | 45.26 | 45.26 | 45.26 |
| EBITDA | 5,392.9 | 6,183.9 | 8,522.9 | 4,880.2 | 8,358.5 | 22,787.1 | 33,099.8 | 48,079.6 | 69,838.9 | 101,445.7 |
| EBITDA, % | 73.25 | 63.05 | 58.17 | 21.09 | 25.71 | 48.26 | 48.26 | 48.26 | 48.26 | 48.26 |
| Depreciation | 105.1 | 98.8 | 439.1 | 878.7 | 1,017.1 | 1,167.2 | 1,695.4 | 2,462.7 | 3,577.2 | 5,196.2 |
| Depreciation, % | 1.43 | 1.01 | 3 | 3.8 | 3.13 | 2.47 | 2.47 | 2.47 | 2.47 | 2.47 |
| EBIT | 5,287.8 | 6,085.2 | 8,083.8 | 4,001.5 | 7,341.3 | 21,619.9 | 31,404.4 | 45,616.9 | 66,261.7 | 96,249.6 |
| EBIT, % | 71.82 | 62.05 | 55.17 | 17.3 | 22.58 | 45.78 | 45.78 | 45.78 | 45.78 | 45.78 |
| Total Cash | 8,264.8 | 5,715.9 | 15,102.8 | 8,661.3 | 15,311.1 | 32,375.9 | 47,028.2 | 68,311.6 | 99,227.3 | 144,134.3 |
| Total Cash, percent | .0 | .0 | .0 | .0 | .0 | .0 | .0 | .0 | .0 | .0 |
| Account Receivables | 58.1 | 263.4 | 950.5 | 37,440.0 | 864.0 | 10,635.9 | 15,449.3 | 22,441.2 | 32,597.4 | 47,349.9 |
| Account Receivables, % | 0.78864 | 2.69 | 6.49 | 161.82 | 2.66 | 22.52 | 22.52 | 22.52 | 22.52 | 22.52 |
| Inventories | -58.1 | -54,210.6 | 93,912.4 | .0 | .0 | -74.5 | -108.2 | -157.1 | -228.3 | -331.6 |
| Inventories, % | -0.78864 | -552.75 | 640.99 | 0 | 0 | -0.15773 | -0.15773 | -0.15773 | -0.15773 | -0.15773 |
| Accounts Payable | 74.9 | 334.9 | 965.8 | 1,310.8 | 1,025.3 | 1,874.0 | 2,722.2 | 3,954.2 | 5,743.7 | 8,343.1 |
| Accounts Payable, % | 1.02 | 3.41 | 6.59 | 5.67 | 3.15 | 3.97 | 3.97 | 3.97 | 3.97 | 3.97 |
| Capital Expenditure | -45.9 | -118.3 | -1,311.9 | -635.7 | -654.3 | -1,467.9 | -2,132.3 | -3,097.3 | -4,499.0 | -6,535.1 |
| Capital Expenditure, % | -0.62347 | -1.21 | -8.95 | -2.75 | -2.01 | -3.11 | -3.11 | -3.11 | -3.11 | -3.11 |
| Tax Rate, % | 24.44 | 24.44 | 24.44 | 24.44 | 24.44 | 24.44 | 24.44 | 24.44 | 24.44 | 24.44 |
| EBITAT | 3,969.6 | 4,576.7 | 6,166.5 | 3,057.8 | 5,547.1 | 16,368.0 | 23,775.6 | 34,535.7 | 50,165.5 | 72,868.7 |
| Depreciation | ||||||||||
| Changes in Account Receivables | ||||||||||
| Changes in Inventories | ||||||||||
| Changes in Accounts Payable | ||||||||||
| Capital Expenditure | ||||||||||
| UFCF | 4,103.8 | 58,764.3 | -142,885.3 | 61,068.5 | 42,200.4 | 7,218.6 | 19,407.2 | 28,190.2 | 40,948.2 | 59,480.0 |
| WACC, % | 3.73 | 3.74 | 3.76 | 3.76 | 3.74 | 3.75 | 3.75 | 3.75 | 3.75 | 3.75 |
| PV UFCF | ||||||||||
| SUM PV UFCF | 135,075.6 | |||||||||
| Long Term Growth Rate, % | 2.00 | |||||||||
| Free cash flow (T + 1) | 60,670 | |||||||||
| Terminal Value | 3,476,737 | |||||||||
| Present Terminal Value | 2,892,915 | |||||||||
| Enterprise Value | 3,027,990 | |||||||||
| Net Debt | 140,456 | |||||||||
| Equity Value | 2,887,534 | |||||||||
| Diluted Shares Outstanding, MM | 829 | |||||||||
| Equity Value Per Share | 3,481.70 |
What You Will Receive
- Authentic CGCLNS Data: Preloaded financial metrics – encompassing revenue to EBIT – derived from actual and projected information.
- Comprehensive Customization: Modify all essential parameters (highlighted in yellow) such as WACC, growth %, and tax rates.
- Real-Time Valuation Adjustments: Automatic recalculations to assess the effects of changes on CGCLNS’s fair value.
- Flexible Excel Template: Designed for easy edits, scenario analysis, and thorough projections.
- Efficient and Precise: Bypass building models from the ground up while ensuring accuracy and adaptability.
Key Features
- Real-Time CGCLNS Data: Includes historical financials and future forecasts for Capri Global Capital Limited.
- Fully Customizable Parameters: Tailor revenue growth rates, profit margins, WACC, tax rates, and capital investments.
- Interactive Valuation Model: Automatically updates Net Present Value (NPV) and intrinsic value based on your specified parameters.
- Scenario Analysis: Develop various forecasting scenarios to explore different valuation results.
- User-Friendly Interface: Intuitive and organized design suitable for both seasoned professionals and newcomers.
How It Works
- Step 1: Download the ready-to-use Excel template featuring Capri Global Capital Limited (CGCLNS) data.
- Step 2: Navigate through the pre-filled sheets to familiarize yourself with the essential metrics.
- Step 3: Modify forecasts and assumptions in the editable yellow cells (WACC, growth, margins).
- Step 4: Instantly see the updated results, which include the intrinsic value of Capri Global Capital Limited (CGCLNS).
- Step 5: Utilize the output for informed investment decisions or to create detailed reports.
Why Choose This Calculator?
- User-Friendly Interface: Tailored for both novices and seasoned professionals.
- Customizable Inputs: Adjust variables effortlessly to suit your financial analysis.
- Real-Time Updates: Monitor immediate changes in Capri Global Capital Limited's (CGCLNS) valuation as you modify inputs.
- Pre-Configured: Comes with Capri Global Capital Limited's (CGCLNS) actual financial metrics for swift evaluations.
- Relied Upon by Experts: A trusted tool among investors and analysts for making strategic decisions.
Who Can Benefit from This Product?
- Individual Investors: Gain insights to make informed decisions regarding buying or selling CGCLNS (Capri Global Capital Limited) shares.
- Financial Analysts: Enhance valuation processes with pre-built financial models tailored for CGCLNS.
- Consultants: Provide clients with accurate and timely valuation analyses related to CGCLNS.
- Business Owners: Learn how major players like CGCLNS are appraised to refine your strategic approach.
- Finance Students: Master valuation methods by working with real data and case studies involving CGCLNS.
Contents of the Template
- Pre-Filled Data: Contains historical financials and projections for Capri Global Capital Limited (CGCLNS).
- Discounted Cash Flow Model: An editable DCF valuation model featuring automatic calculations.
- Weighted Average Cost of Capital (WACC): A specialized sheet for WACC calculations based on user-defined inputs.
- Key Financial Ratios: Assess the profitability, efficiency, and leverage of Capri Global Capital Limited (CGCLNS).
- Customizable Inputs: Easily modify revenue growth, profit margins, and tax rates.
- Comprehensive Dashboard: Visual representations and tables that summarize essential valuation outcomes.
Disclaimer
All information, articles, and product details provided on this website are for general informational and educational purposes only. We do not claim any ownership over, nor do we intend to infringe upon, any trademarks, copyrights, logos, brand names, or other intellectual property mentioned or depicted on this site. Such intellectual property remains the property of its respective owners, and any references here are made solely for identification or informational purposes, without implying any affiliation, endorsement, or partnership.
We make no representations or warranties, express or implied, regarding the accuracy, completeness, or suitability of any content or products presented. Nothing on this website should be construed as legal, tax, investment, financial, medical, or other professional advice. In addition, no part of this site—including articles or product references—constitutes a solicitation, recommendation, endorsement, advertisement, or offer to buy or sell any securities, franchises, or other financial instruments, particularly in jurisdictions where such activity would be unlawful.
All content is of a general nature and may not address the specific circumstances of any individual or entity. It is not a substitute for professional advice or services. Any actions you take based on the information provided here are strictly at your own risk. You accept full responsibility for any decisions or outcomes arising from your use of this website and agree to release us from any liability in connection with your use of, or reliance upon, the content or products found herein.