
|
LaDpoint Holdings, Inc. (CHPT) DCF -Bewertung |
Fully Editable: Tailor To Your Needs In Excel Or Sheets
Professional Design: Trusted, Industry-Standard Templates
Investor-Approved Valuation Models
MAC/PC Compatible, Fully Unlocked
No Expertise Is Needed; Easy To Follow
ChargePoint Holdings, Inc. (CHPT) Bundle
Evaluieren Sie die finanziellen Aussichten für LaDoint Holdings, Inc. (CHPT) wie ein Experte! Dieser (CHPT) DCF-Taschenrechner bietet vorgefüllte Finanzdaten und bietet vollständige Flexibilität, um das Umsatzwachstum, WACC, Margen und andere wichtige Annahmen zu ändern, um sich an Ihren Vorhersagen auszurichten.
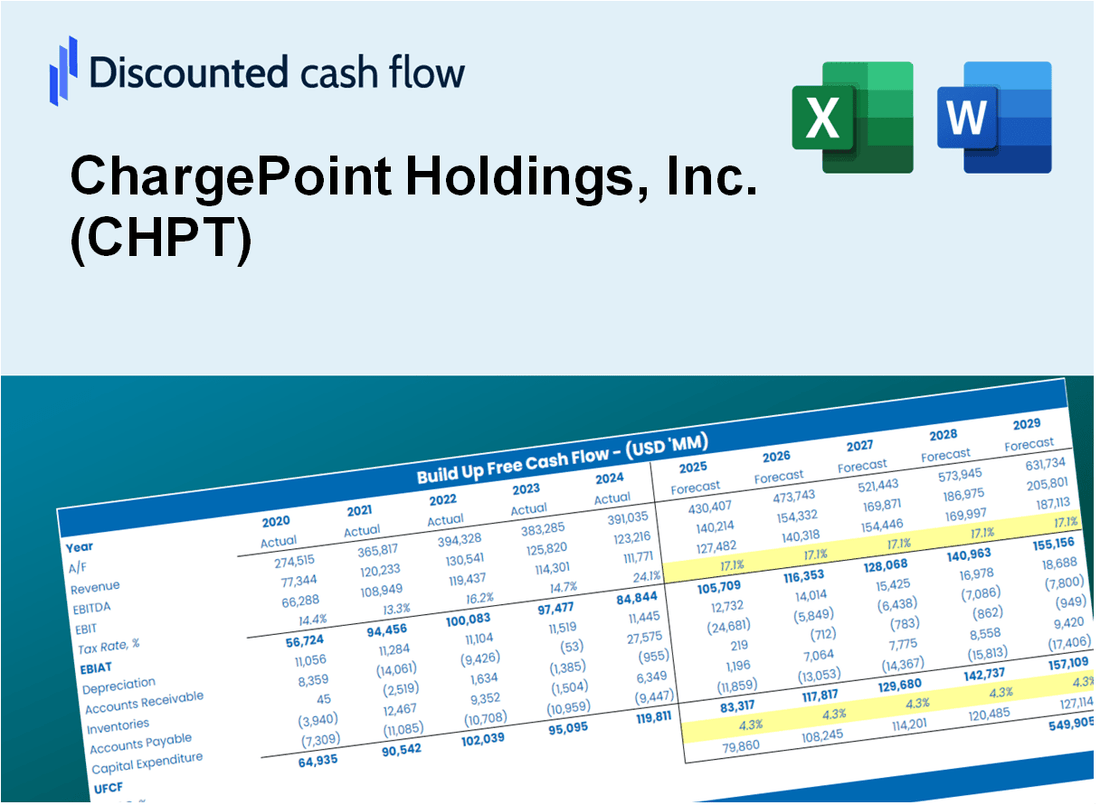
Discounted Cash Flow (DCF) - (USD MM)
| Year | AY1 2021 |
AY2 2022 |
AY3 2023 |
AY4 2024 |
AY5 2025 |
FY1 2026 |
FY2 2027 |
FY3 2028 |
FY4 2029 |
FY5 2030 |
|---|---|---|---|---|---|---|---|---|---|---|
| Revenue | 146.5 | 242.3 | 468.1 | 506.6 | 417.1 | 572.6 | 786.1 | 1,079.2 | 1,481.6 | 2,034.0 |
| Revenue Growth, % | 0 | 65.43 | 93.16 | 8.23 | -17.68 | 37.29 | 37.29 | 37.29 | 37.29 | 37.29 |
| EBITDA | -183.5 | -117.2 | -312.8 | -412.9 | -218.8 | -399.8 | -548.9 | -753.6 | -1,034.6 | -1,420.4 |
| EBITDA, % | -125.26 | -48.37 | -66.82 | -81.49 | -52.47 | -69.83 | -69.83 | -69.83 | -69.83 | -69.83 |
| Depreciation | 13.8 | 20.7 | 29.8 | 28.5 | 29.2 | 42.3 | 58.1 | 79.8 | 109.6 | 150.4 |
| Depreciation, % | 9.45 | 8.54 | 6.36 | 5.62 | 7 | 7.4 | 7.4 | 7.4 | 7.4 | 7.4 |
| EBIT | -197.3 | -137.9 | -342.6 | -441.4 | -248.0 | -431.4 | -592.2 | -813.0 | -1,116.2 | -1,532.4 |
| EBIT, % | -134.71 | -56.91 | -73.19 | -87.11 | -59.47 | -75.34 | -75.34 | -75.34 | -75.34 | -75.34 |
| Total Cash | 145.5 | 315.2 | 369.1 | 327.4 | 224.6 | 454.2 | 623.6 | 856.1 | 1,175.3 | 1,613.6 |
| Total Cash, percent | .0 | .0 | .0 | .0 | .0 | .0 | .0 | .0 | .0 | .0 |
| Account Receivables | 35.1 | 75.9 | 164.9 | 124.0 | 95.9 | 158.0 | 216.9 | 297.8 | 408.9 | 561.3 |
| Account Receivables, % | 23.94 | 31.34 | 35.23 | 24.48 | 22.99 | 27.6 | 27.6 | 27.6 | 27.6 | 27.6 |
| Inventories | 33.6 | 35.4 | 68.7 | 198.6 | 209.3 | 162.1 | 222.6 | 305.6 | 419.5 | 576.0 |
| Inventories, % | 22.93 | 14.6 | 14.68 | 39.2 | 50.17 | 28.32 | 28.32 | 28.32 | 28.32 | 28.32 |
| Accounts Payable | 19.8 | 27.6 | 62.1 | 71.1 | 64.1 | 77.3 | 106.2 | 145.8 | 200.1 | 274.7 |
| Accounts Payable, % | 13.51 | 11.38 | 13.26 | 14.03 | 15.36 | 13.51 | 13.51 | 13.51 | 13.51 | 13.51 |
| Capital Expenditure | -11.5 | -16.4 | -18.6 | -19.4 | -12.1 | -29.0 | -39.8 | -54.6 | -75.0 | -102.9 |
| Capital Expenditure, % | -7.84 | -6.77 | -3.97 | -3.83 | -2.89 | -5.06 | -5.06 | -5.06 | -5.06 | -5.06 |
| Tax Rate, % | -1.6 | -1.6 | -1.6 | -1.6 | -1.6 | -1.6 | -1.6 | -1.6 | -1.6 | -1.6 |
| EBITAT | -197.5 | -134.7 | -339.2 | -441.3 | -252.0 | -428.5 | -588.2 | -807.6 | -1,108.7 | -1,522.0 |
| Depreciation | ||||||||||
| Changes in Account Receivables | ||||||||||
| Changes in Inventories | ||||||||||
| Changes in Accounts Payable | ||||||||||
| Capital Expenditure | ||||||||||
| UFCF | -244.1 | -165.2 | -415.7 | -512.3 | -224.5 | -416.8 | -660.4 | -906.7 | -1,244.7 | -1,708.8 |
| WACC, % | 8.84 | 8.73 | 8.79 | 8.84 | 8.84 | 8.81 | 8.81 | 8.81 | 8.81 | 8.81 |
| PV UFCF | ||||||||||
| SUM PV UFCF | -3,653.0 | |||||||||
| Long Term Growth Rate, % | 2.00 | |||||||||
| Free cash flow (T + 1) | -1,743 | |||||||||
| Terminal Value | -25,596 | |||||||||
| Present Terminal Value | -16,781 | |||||||||
| Enterprise Value | -20,434 | |||||||||
| Net Debt | 88 | |||||||||
| Equity Value | -20,522 | |||||||||
| Diluted Shares Outstanding, MM | 22 | |||||||||
| Equity Value Per Share | -946.84 |
What You Will Receive
- Customizable Excel Template: A fully adaptable Excel-based DCF Calculator featuring pre-filled real CHPT financials.
- Actual Data: Historical data along with forward-looking estimates (highlighted in the yellow cells).
- Forecasting Flexibility: Adjust forecast assumptions such as revenue growth, EBITDA %, and WACC.
- Instant Calculations: Quickly observe how your inputs affect ChargePoint's valuation.
- Professional Resource: Designed for investors, CFOs, consultants, and financial analysts.
- User-Friendly Layout: Organized for clarity and simplicity, complete with step-by-step guidance.
Key Features
- Comprehensive Data: ChargePoint’s historical financial reports and pre-filled projections.
- Customizable Inputs: Modify WACC, tax rates, revenue growth, and EBITDA margins as needed.
- Real-Time Insights: Observe ChargePoint’s intrinsic value recalculating instantly.
- Informative Visual Outputs: Dashboard graphs illustrate valuation results and essential metrics.
- Designed for Precision: A professional-grade tool for analysts, investors, and finance professionals.
How It Works
- Step 1: Download the Excel file for ChargePoint Holdings, Inc. (CHPT).
- Step 2: Examine ChargePoint's pre-filled financial data and projections.
- Step 3: Adjust key inputs such as revenue growth, WACC, and tax rates (highlighted cells).
- Step 4: Observe the DCF model update in real-time as you modify your assumptions.
- Step 5: Evaluate the outputs and utilize the findings for your investment strategies.
Why Choose This Calculator for ChargePoint Holdings, Inc. (CHPT)?
- Accurate Data: Up-to-date ChargePoint financials provide trustworthy valuation outcomes.
- Customizable: Tailor essential variables like growth rates, WACC, and tax rates to fit your forecasts.
- Time-Saving: Built-in calculations save you from starting from the ground up.
- Professional-Grade Tool: Crafted for investors, analysts, and consultants in the EV sector.
- User-Friendly: Easy-to-navigate design and clear instructions make it accessible for everyone.
Who Should Use ChargePoint Holdings, Inc. (CHPT)?
- Electric Vehicle Enthusiasts: Understand the charging infrastructure and its impact on the EV market.
- Researchers: Utilize ChargePoint's data for studies on sustainable transportation and energy solutions.
- Investors: Evaluate your investment strategies and assess the growth potential of ChargePoint Holdings, Inc. (CHPT).
- Industry Analysts: Enhance your reports with a detailed analysis of ChargePoint's market position and performance.
- Small Business Owners: Discover how electric vehicle charging solutions can benefit your business operations.
What the Template Contains
- Preloaded CHPT Data: Historical and projected financial data, including revenue, EBIT, and capital expenditures.
- DCF and WACC Models: Professional-grade sheets for calculating intrinsic value and Weighted Average Cost of Capital.
- Editable Inputs: Yellow-highlighted cells for adjusting revenue growth, tax rates, and discount rates.
- Financial Statements: Comprehensive annual and quarterly financials for deeper analysis.
- Key Ratios: Profitability, leverage, and efficiency ratios to evaluate performance.
- Dashboard and Charts: Visual summaries of valuation outcomes and assumptions.
Disclaimer
All information, articles, and product details provided on this website are for general informational and educational purposes only. We do not claim any ownership over, nor do we intend to infringe upon, any trademarks, copyrights, logos, brand names, or other intellectual property mentioned or depicted on this site. Such intellectual property remains the property of its respective owners, and any references here are made solely for identification or informational purposes, without implying any affiliation, endorsement, or partnership.
We make no representations or warranties, express or implied, regarding the accuracy, completeness, or suitability of any content or products presented. Nothing on this website should be construed as legal, tax, investment, financial, medical, or other professional advice. In addition, no part of this site—including articles or product references—constitutes a solicitation, recommendation, endorsement, advertisement, or offer to buy or sell any securities, franchises, or other financial instruments, particularly in jurisdictions where such activity would be unlawful.
All content is of a general nature and may not address the specific circumstances of any individual or entity. It is not a substitute for professional advice or services. Any actions you take based on the information provided here are strictly at your own risk. You accept full responsibility for any decisions or outcomes arising from your use of this website and agree to release us from any liability in connection with your use of, or reliance upon, the content or products found herein.