
|
Clean Science and Technology Limited (Clean.NS) DCF -Bewertung |
Fully Editable: Tailor To Your Needs In Excel Or Sheets
Professional Design: Trusted, Industry-Standard Templates
Investor-Approved Valuation Models
MAC/PC Compatible, Fully Unlocked
No Expertise Is Needed; Easy To Follow
Clean Science and Technology Limited (CLEAN.NS) Bundle
Verbessern Sie Ihre Anlagestrategie mit dem DCF -Taschenrechner (CleanNS)! Verwenden Sie genaue Finanzdaten aus Clean Science and Technology Limited, passen Sie die Wachstumsprojektionen und -kosten an und beobachten Sie sofort, wie sich diese Veränderungen auf den inneren Wert Ihrer Investition in (CleanNS) auswirken.
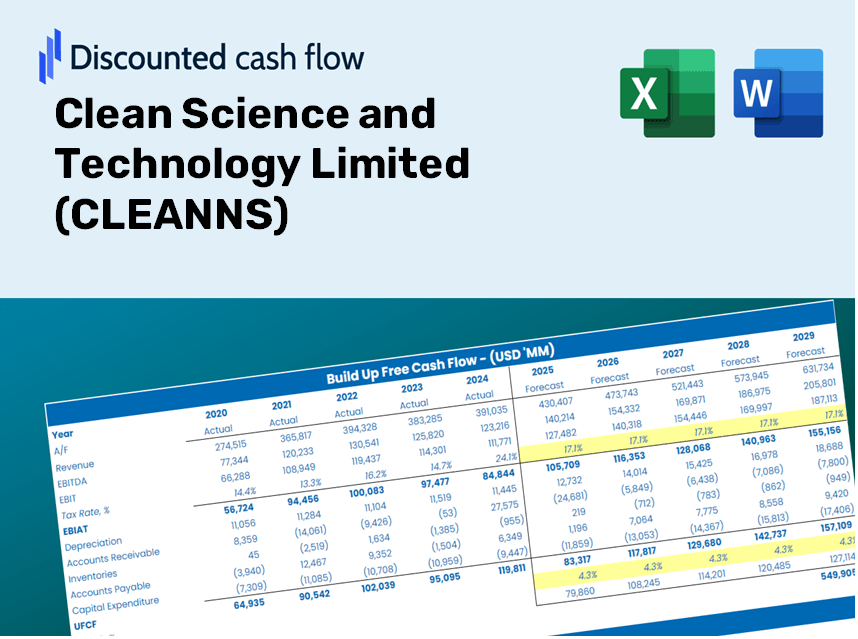
Discounted Cash Flow (DCF) - (USD MM)
| Year | AY1 2021 |
AY2 2022 |
AY3 2023 |
AY4 2024 |
AY5 2025 |
FY1 2026 |
FY2 2027 |
FY3 2028 |
FY4 2029 |
FY5 2030 |
|---|---|---|---|---|---|---|---|---|---|---|
| Revenue | 5,124.3 | 6,848.9 | 9,358.0 | 7,914.9 | 9,666.4 | 11,527.2 | 13,746.2 | 16,392.3 | 19,547.9 | 23,310.8 |
| Revenue Growth, % | 0 | 33.66 | 36.64 | -15.42 | 22.13 | 19.25 | 19.25 | 19.25 | 19.25 | 19.25 |
| EBITDA | 2,591.5 | 2,997.6 | 4,017.3 | 3,312.4 | 3,867.9 | 5,052.0 | 6,024.5 | 7,184.2 | 8,567.2 | 10,216.4 |
| EBITDA, % | 50.57 | 43.77 | 42.93 | 41.85 | 40.01 | 43.83 | 43.83 | 43.83 | 43.83 | 43.83 |
| Depreciation | 170.9 | 247.9 | 356.5 | 451.0 | 682.1 | 542.2 | 646.5 | 771.0 | 919.4 | 1,096.4 |
| Depreciation, % | 3.33 | 3.62 | 3.81 | 5.7 | 7.06 | 4.7 | 4.7 | 4.7 | 4.7 | 4.7 |
| EBIT | 2,420.6 | 2,749.7 | 3,660.9 | 2,861.4 | 3,185.8 | 4,509.8 | 5,378.0 | 6,413.2 | 7,647.8 | 9,119.9 |
| EBIT, % | 47.24 | 40.15 | 39.12 | 36.15 | 32.96 | 39.12 | 39.12 | 39.12 | 39.12 | 39.12 |
| Total Cash | 2,478.2 | 2,970.7 | 3,420.5 | 3,131.5 | 3,642.6 | 4,738.5 | 5,650.7 | 6,738.4 | 8,035.6 | 9,582.4 |
| Total Cash, percent | .0 | .0 | .0 | .0 | .0 | .0 | .0 | .0 | .0 | .0 |
| Account Receivables | 742.3 | 1,549.7 | 1,471.9 | 1,637.3 | 2,033.9 | 2,180.2 | 2,599.9 | 3,100.4 | 3,697.2 | 4,409.0 |
| Account Receivables, % | 14.48 | 22.63 | 15.73 | 20.69 | 21.04 | 18.91 | 18.91 | 18.91 | 18.91 | 18.91 |
| Inventories | 529.0 | 881.3 | 1,088.1 | 1,257.1 | 1,494.3 | 1,525.3 | 1,818.9 | 2,169.0 | 2,586.6 | 3,084.5 |
| Inventories, % | 10.32 | 12.87 | 11.63 | 15.88 | 15.46 | 13.23 | 13.23 | 13.23 | 13.23 | 13.23 |
| Accounts Payable | 609.9 | 1,021.1 | 805.1 | 1,084.6 | 989.0 | 1,368.3 | 1,631.7 | 1,945.8 | 2,320.3 | 2,767.0 |
| Accounts Payable, % | 11.9 | 14.91 | 8.6 | 13.7 | 10.23 | 11.87 | 11.87 | 11.87 | 11.87 | 11.87 |
| Capital Expenditure | -844.2 | -1,396.5 | -1,834.1 | -2,322.9 | -1,419.5 | -2,316.9 | -2,762.9 | -3,294.8 | -3,929.1 | -4,685.4 |
| Capital Expenditure, % | -16.48 | -20.39 | -19.6 | -29.35 | -14.68 | -20.1 | -20.1 | -20.1 | -20.1 | -20.1 |
| Tax Rate, % | 25.88 | 25.88 | 25.88 | 25.88 | 25.88 | 25.88 | 25.88 | 25.88 | 25.88 | 25.88 |
| EBITAT | 1,796.5 | 2,061.4 | 2,731.3 | 2,138.6 | 2,361.3 | 3,361.2 | 4,008.2 | 4,779.8 | 5,699.9 | 6,797.1 |
| Depreciation | ||||||||||
| Changes in Account Receivables | ||||||||||
| Changes in Inventories | ||||||||||
| Changes in Accounts Payable | ||||||||||
| Capital Expenditure | ||||||||||
| UFCF | 461.8 | 164.2 | 908.7 | 211.7 | 894.6 | 1,788.3 | 1,441.9 | 1,719.4 | 2,050.4 | 2,445.1 |
| WACC, % | 4.69 | 4.69 | 4.69 | 4.69 | 4.69 | 4.69 | 4.69 | 4.69 | 4.69 | 4.69 |
| PV UFCF | ||||||||||
| SUM PV UFCF | 8,173.9 | |||||||||
| Long Term Growth Rate, % | 2.00 | |||||||||
| Free cash flow (T + 1) | 2,494 | |||||||||
| Terminal Value | 92,739 | |||||||||
| Present Terminal Value | 73,748 | |||||||||
| Enterprise Value | 81,922 | |||||||||
| Net Debt | -181 | |||||||||
| Equity Value | 82,103 | |||||||||
| Diluted Shares Outstanding, MM | 106 | |||||||||
| Equity Value Per Share | 772.55 |
What You Will Receive
- Authentic CLEANNS Data: Preloaded financial metrics – encompassing revenue to EBIT – derived from both actual and projected figures.
- Comprehensive Customization: Modify all essential parameters (highlighted cells) such as WACC, growth %, and tax rates.
- Immediate Valuation Adjustments: Automatic recalculations to evaluate how changes affect CLEANNS's fair value.
- Flexible Excel Template: Designed for easy modifications, scenario analysis, and in-depth forecasting.
- Efficient and Reliable: Eliminate the need to create models from the ground up while ensuring accuracy and adaptability.
Key Features
- Authentic CLEANNS Financials: Gain access to reliable pre-loaded historical data and forward-looking projections.
- Adjustable Forecast Assumptions: Modify yellow-highlighted cells for parameters like WACC, growth rates, and profit margins.
- Real-Time Calculations: Automatic refresh of DCF, Net Present Value (NPV), and cash flow analyses.
- Interactive Dashboard: User-friendly charts and summaries that help visualize your valuation outcomes.
- Designed for All Skill Levels: An intuitive layout created for investors, CFOs, and consultants alike.
How It Works
- 1. Download the Template: Acquire and open the Excel file featuring Clean Science and Technology Limited’s (CLEANNS) preloaded data.
- 2. Modify Key Inputs: Adjust essential parameters such as growth projections, WACC, and capital expenditures.
- 3. Instant Results: The DCF model automatically computes intrinsic value and NPV for you.
- 4. Evaluate Scenarios: Analyze various forecasts to explore different valuation possibilities.
- 5. Present with Assurance: Deliver professional valuation analyses to back up your strategic decisions.
Why Opt for Our Calculator?
- Precision: Utilizes real financial data from Clean Science and Technology Limited (CLEANNS) for reliable results.
- Versatility: Built to allow users to easily experiment with and adjust their inputs.
- Efficiency: Eliminate the complexity of constructing a DCF model from the ground up.
- Top-Tier Quality: Crafted with the expertise and attention to detail expected by CFOs.
- User-Friendly: Designed for ease of use, even for individuals without extensive financial modeling backgrounds.
Who Should Consider Clean Science and Technology Limited (CLEANNS)?
- Individual Investors: Make educated choices regarding the acquisition or sale of Clean Science and Technology shares.
- Financial Analysts: Enhance valuation methodologies with accessible financial models tailored for CLEANNS.
- Consultants: Provide clients with timely and precise valuation insights related to CLEANNS.
- Business Owners: Gain an understanding of how innovative companies like Clean Science and Technology are appraised to inform your own business strategies.
- Finance Students: Explore valuation principles using real-time data and practical examples related to CLEANNS.
Contents of the Template
- Operating and Balance Sheet Data: Pre-filled historical data and forecasts for Clean Science and Technology Limited (CLEANNS), including revenue, EBITDA, EBIT, and capital expenditures.
- WACC Calculation: A dedicated sheet for Weighted Average Cost of Capital (WACC), featuring key parameters such as Beta, risk-free rate, and share price.
- DCF Valuation (Unlevered and Levered): Customizable Discounted Cash Flow models that present intrinsic value along with thorough calculations.
- Financial Statements: Pre-loaded annual and quarterly financial statements to enhance analysis.
- Key Ratios: A collection of profitability, leverage, and efficiency ratios specific to Clean Science and Technology Limited (CLEANNS).
- Dashboard and Charts: A visual overview of valuation outputs and assumptions for easier result analysis.
Disclaimer
All information, articles, and product details provided on this website are for general informational and educational purposes only. We do not claim any ownership over, nor do we intend to infringe upon, any trademarks, copyrights, logos, brand names, or other intellectual property mentioned or depicted on this site. Such intellectual property remains the property of its respective owners, and any references here are made solely for identification or informational purposes, without implying any affiliation, endorsement, or partnership.
We make no representations or warranties, express or implied, regarding the accuracy, completeness, or suitability of any content or products presented. Nothing on this website should be construed as legal, tax, investment, financial, medical, or other professional advice. In addition, no part of this site—including articles or product references—constitutes a solicitation, recommendation, endorsement, advertisement, or offer to buy or sell any securities, franchises, or other financial instruments, particularly in jurisdictions where such activity would be unlawful.
All content is of a general nature and may not address the specific circumstances of any individual or entity. It is not a substitute for professional advice or services. Any actions you take based on the information provided here are strictly at your own risk. You accept full responsibility for any decisions or outcomes arising from your use of this website and agree to release us from any liability in connection with your use of, or reliance upon, the content or products found herein.