
|
Clearfield, Inc. (CLFD) DCF -Bewertung |
Fully Editable: Tailor To Your Needs In Excel Or Sheets
Professional Design: Trusted, Industry-Standard Templates
Investor-Approved Valuation Models
MAC/PC Compatible, Fully Unlocked
No Expertise Is Needed; Easy To Follow
Clearfield, Inc. (CLFD) Bundle
Optimieren Sie Ihre Zeit und steigern Sie die Präzision mit unserem (CLFD) DCF -Taschenrechner! Mit diesem Tool können Sie mit Daten und anpassbaren Annahmen von Clearfield, Inc. ausgestattet sind und ermöglicht es Ihnen, wie ein erfahrener Investor prognostiziert, analysieren und Value Clearfield, Inc.
What You Will Get
- Editable Forecast Inputs: Easily modify assumptions (growth %, margins, WACC) to explore various scenarios.
- Real-World Data: Clearfield, Inc.’s (CLFD) financial data pre-filled to expedite your analysis.
- Automatic DCF Outputs: The template computes Net Present Value (NPV) and intrinsic value automatically.
- Customizable and Professional: A refined Excel model tailored to meet your valuation requirements.
- Built for Analysts and Investors: Perfect for assessing projections, validating strategies, and enhancing efficiency.
Key Features
- Real-Time CLFD Data: Pre-filled with Clearfield, Inc.'s historical financials and future projections.
- Customizable Inputs: Modify revenue growth, profit margins, WACC, tax rates, and capital expenditures to suit your analysis.
- Dynamic Valuation Model: Automatically updates Net Present Value (NPV) and intrinsic value based on your customized inputs.
- Scenario Analysis: Generate multiple forecasting scenarios to explore various valuation results.
- User-Friendly Interface: Intuitive and organized, catering to both industry professionals and novices.
How It Works
- Step 1: Download the Excel file for Clearfield, Inc. (CLFD).
- Step 2: Review Clearfield’s pre-filled financial data and forecasts.
- Step 3: Modify key inputs such as revenue growth, WACC, and tax rates (highlighted cells).
- Step 4: Observe the DCF model update in real-time as you adjust your assumptions.
- Step 5: Analyze the outputs and leverage the results for informed investment decisions.
Why Choose This Calculator for Clearfield, Inc. (CLFD)?
- All-in-One Solution: Combines DCF, WACC, and key financial ratio analyses for comprehensive assessments.
- Flexible Inputs: Modify the highlighted cells to explore different financial scenarios.
- In-Depth Analysis: Automatically computes Clearfield's intrinsic value and Net Present Value.
- Ready-to-Use Data: Historical and projected data provide reliable benchmarks for analysis.
- High-Quality Insights: Perfect for financial analysts, investors, and business advisors focused on Clearfield, Inc. (CLFD).
Who Should Use Clearfield, Inc. (CLFD)?
- Telecommunications Students: Explore network infrastructure concepts and apply them to real-world scenarios.
- Researchers: Utilize industry-specific models in your studies on broadband technology.
- Investors: Evaluate your strategies and assess the market performance of Clearfield, Inc. (CLFD).
- Market Analysts: Enhance your analysis with a ready-to-use, customizable financial model for Clearfield, Inc. (CLFD).
- Entrepreneurs: Understand how established companies like Clearfield, Inc. (CLFD) navigate the telecommunications landscape.
What the Template Contains
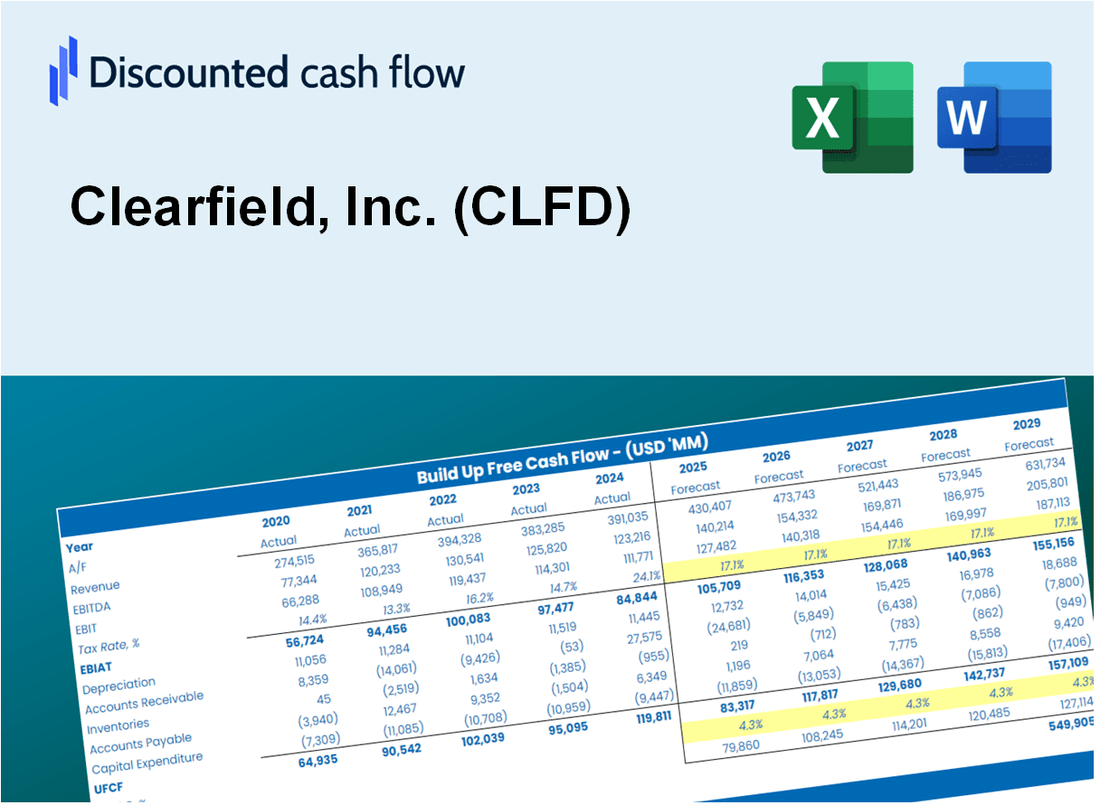
- Operating and Balance Sheet Data: Pre-filled Clearfield, Inc. (CLFD) historical data and forecasts, including revenue, EBITDA, EBIT, and capital expenditures.
- WACC Calculation: A dedicated sheet for Weighted Average Cost of Capital (WACC), including parameters like Beta, risk-free rate, and share price.
- DCF Valuation (Unlevered and Levered): Editable Discounted Cash Flow models showing intrinsic value with detailed calculations.
- Financial Statements: Pre-loaded financial statements (annual and quarterly) to support analysis.
- Key Ratios: Includes profitability, leverage, and efficiency ratios for Clearfield, Inc. (CLFD).
- Dashboard and Charts: Visual summary of valuation outputs and assumptions to analyze results easily.
Disclaimer
All information, articles, and product details provided on this website are for general informational and educational purposes only. We do not claim any ownership over, nor do we intend to infringe upon, any trademarks, copyrights, logos, brand names, or other intellectual property mentioned or depicted on this site. Such intellectual property remains the property of its respective owners, and any references here are made solely for identification or informational purposes, without implying any affiliation, endorsement, or partnership.
We make no representations or warranties, express or implied, regarding the accuracy, completeness, or suitability of any content or products presented. Nothing on this website should be construed as legal, tax, investment, financial, medical, or other professional advice. In addition, no part of this site—including articles or product references—constitutes a solicitation, recommendation, endorsement, advertisement, or offer to buy or sell any securities, franchises, or other financial instruments, particularly in jurisdictions where such activity would be unlawful.
All content is of a general nature and may not address the specific circumstances of any individual or entity. It is not a substitute for professional advice or services. Any actions you take based on the information provided here are strictly at your own risk. You accept full responsibility for any decisions or outcomes arising from your use of this website and agree to release us from any liability in connection with your use of, or reliance upon, the content or products found herein.