
|
Clearone, Inc. (CLRO) DCF -Bewertung |
Fully Editable: Tailor To Your Needs In Excel Or Sheets
Professional Design: Trusted, Industry-Standard Templates
Investor-Approved Valuation Models
MAC/PC Compatible, Fully Unlocked
No Expertise Is Needed; Easy To Follow
ClearOne, Inc. (CLRO) Bundle
Entdecken Sie den wirklichen Wert von Clearone, Inc. (CLRO) mit unserem fortschrittlichen DCF -Taschenrechner! Passen Sie die wesentlichen Annahmen an, erkunden Sie verschiedene Szenarien und bewerten Sie, wie unterschiedliche Veränderungen die Bewertung von Clearone, Inc. (CLRO) beeinflussen - alles innerhalb einer bequemen Excel -Vorlage.
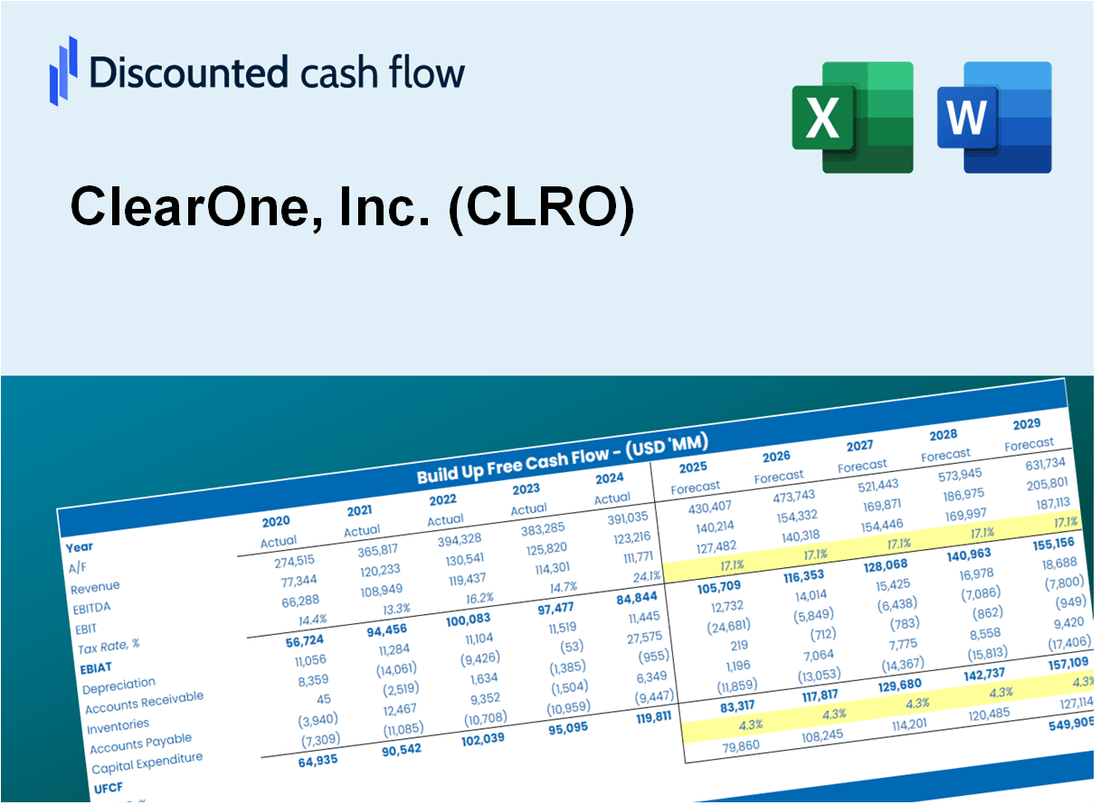
Discounted Cash Flow (DCF) - (USD MM)
| Year | AY1 2020 |
AY2 2021 |
AY3 2022 |
AY4 2023 |
AY5 2024 |
FY1 2025 |
FY2 2026 |
FY3 2027 |
FY4 2028 |
FY5 2029 |
|---|---|---|---|---|---|---|---|---|---|---|
| Revenue | 29.1 | 29.0 | 25.2 | 18.7 | 11.4 | 9.2 | 7.4 | 5.9 | 4.8 | 3.8 |
| Revenue Growth, % | 0 | -0.35089 | -12.99 | -25.79 | -39.13 | -19.56 | -19.56 | -19.56 | -19.56 | -19.56 |
| EBITDA | -2.8 | -4.2 | -3.9 | 1.6 | -8.3 | -1.9 | -1.5 | -1.2 | -1.0 | -.8 |
| EBITDA, % | -9.66 | -14.45 | -15.27 | 8.36 | -72.99 | -20.81 | -20.81 | -20.81 | -20.81 | -20.81 |
| Depreciation | 2.7 | 3.3 | 3.4 | 1.2 | .9 | .9 | .7 | .6 | .5 | .4 |
| Depreciation, % | 9.22 | 11.31 | 13.38 | 6.16 | 7.9 | 9.59 | 9.59 | 9.59 | 9.59 | 9.59 |
| EBIT | -5.5 | -7.5 | -7.2 | .4 | -9.2 | -2.8 | -2.2 | -1.8 | -1.4 | -1.2 |
| EBIT, % | -18.88 | -25.76 | -28.65 | 2.2 | -80.9 | -30.4 | -30.4 | -30.4 | -30.4 | -30.4 |
| Total Cash | 4.9 | 2.9 | 1.0 | 21.3 | 1.4 | 2.6 | 2.1 | 1.7 | 1.4 | 1.1 |
| Total Cash, percent | .0 | .0 | .0 | .0 | .0 | .0 | .0 | .0 | .0 | .0 |
| Account Receivables | 12.4 | 12.5 | 59.7 | 7.3 | 2.2 | 4.5 | 3.6 | 2.9 | 2.3 | 1.9 |
| Account Receivables, % | 42.53 | 43.24 | 236.75 | 39.11 | 19.48 | 48.87 | 48.87 | 48.87 | 48.87 | 48.87 |
| Inventories | 10.5 | 10.0 | 9.0 | 10.6 | 11.2 | 4.8 | 3.9 | 3.1 | 2.5 | 2.0 |
| Inventories, % | 35.99 | 34.64 | 35.55 | 56.81 | 98.58 | 52.31 | 52.31 | 52.31 | 52.31 | 52.31 |
| Accounts Payable | 4.0 | 5.4 | 1.3 | 1.9 | 1.8 | 1.2 | .9 | .8 | .6 | .5 |
| Accounts Payable, % | 13.59 | 18.6 | 5.09 | 10.4 | 15.84 | 12.71 | 12.71 | 12.71 | 12.71 | 12.71 |
| Capital Expenditure | -7.2 | -8.3 | -.9 | -.4 | -.2 | -1.1 | -.9 | -.7 | -.6 | -.5 |
| Capital Expenditure, % | -24.83 | -28.82 | -3.67 | -2 | -1.72 | -12.21 | -12.21 | -12.21 | -12.21 | -12.21 |
| Tax Rate, % | -1.76 | -1.76 | -1.76 | -1.76 | -1.76 | -1.76 | -1.76 | -1.76 | -1.76 | -1.76 |
| EBITAT | .5 | -7.2 | -5.4 | 1.8 | -9.4 | -2.1 | -1.7 | -1.3 | -1.1 | -.9 |
| Depreciation | ||||||||||
| Changes in Account Receivables | ||||||||||
| Changes in Inventories | ||||||||||
| Changes in Accounts Payable | ||||||||||
| Capital Expenditure | ||||||||||
| UFCF | -22.9 | -10.6 | -53.1 | 54.0 | -4.3 | 1.2 | -.3 | -.2 | -.2 | -.1 |
| WACC, % | 4.66 | 4.82 | 4.79 | 4.83 | 4.83 | 4.79 | 4.79 | 4.79 | 4.79 | 4.79 |
| PV UFCF | ||||||||||
| SUM PV UFCF | .5 | |||||||||
| Long Term Growth Rate, % | 0.50 | |||||||||
| Free cash flow (T + 1) | 0 | |||||||||
| Terminal Value | -3 | |||||||||
| Present Terminal Value | -3 | |||||||||
| Enterprise Value | -2 | |||||||||
| Net Debt | -1 | |||||||||
| Equity Value | -1 | |||||||||
| Diluted Shares Outstanding, MM | 24 | |||||||||
| Equity Value Per Share | -0.06 |
What You Will Get
- Editable Forecast Inputs: Easily modify assumptions (growth %, margins, WACC) to explore various scenarios.
- Real-World Data: ClearOne, Inc.'s (CLRO) financial data pre-filled to accelerate your analysis.
- Automatic DCF Outputs: The template computes Net Present Value (NPV) and intrinsic value automatically.
- Customizable and Professional: A sleek Excel model that adjusts to your valuation requirements.
- Built for Analysts and Investors: Perfect for evaluating projections, validating strategies, and enhancing efficiency.
Key Features
- Real-Life CLRO Data: Pre-filled with ClearOne’s historical financials and future projections.
- Fully Customizable Inputs: Adjust revenue growth, profit margins, WACC, tax rates, and capital expenditures.
- Dynamic Valuation Model: Automatic updates to Net Present Value (NPV) and intrinsic value based on your inputs.
- Scenario Testing: Create multiple forecast scenarios to evaluate different valuation outcomes.
- User-Friendly Design: Simple, structured, and designed for both professionals and beginners.
How It Works
- Step 1: Download the Excel file.
- Step 2: Review pre-entered ClearOne, Inc. (CLRO) data (historical and projected).
- Step 3: Adjust key assumptions (yellow cells) based on your analysis.
- Step 4: View automatic recalculations for ClearOne, Inc. (CLRO)'s intrinsic value.
- Step 5: Use the outputs for investment decisions or reporting.
Why Choose This Calculator for ClearOne, Inc. (CLRO)?
- Accurate Data: Real ClearOne financials provide dependable valuation outcomes.
- Customizable: Modify essential parameters such as growth rates, WACC, and tax rates to align with your forecasts.
- Time-Saving: Pre-built calculations streamline the process, saving you from starting from scratch.
- Professional-Grade Tool: Tailored for investors, analysts, and consultants in the field.
- User-Friendly: An intuitive design and step-by-step guidance ensure accessibility for all users.
Who Should Use This Product?
- Investors: Accurately estimate ClearOne, Inc.'s (CLRO) fair value before making investment decisions.
- CFOs: Leverage a professional-grade DCF model for financial reporting and analysis related to ClearOne, Inc. (CLRO).
- Consultants: Quickly adapt the template for valuation reports for clients focusing on ClearOne, Inc. (CLRO).
- Entrepreneurs: Gain insights into financial modeling used by leading companies like ClearOne, Inc. (CLRO).
- Educators: Use it as a teaching tool to demonstrate valuation methodologies applicable to ClearOne, Inc. (CLRO).
What the Template Contains
- Operating and Balance Sheet Data: Pre-filled ClearOne historical data and forecasts, including revenue, EBITDA, EBIT, and capital expenditures.
- WACC Calculation: A dedicated sheet for Weighted Average Cost of Capital (WACC), including parameters like Beta, risk-free rate, and share price.
- DCF Valuation (Unlevered and Levered): Editable Discounted Cash Flow models showing intrinsic value with detailed calculations.
- Financial Statements: Pre-loaded financial statements (annual and quarterly) to support analysis.
- Key Ratios: Includes profitability, leverage, and efficiency ratios for ClearOne, Inc. (CLRO).
- Dashboard and Charts: Visual summary of valuation outputs and assumptions to analyze results easily.
Disclaimer
All information, articles, and product details provided on this website are for general informational and educational purposes only. We do not claim any ownership over, nor do we intend to infringe upon, any trademarks, copyrights, logos, brand names, or other intellectual property mentioned or depicted on this site. Such intellectual property remains the property of its respective owners, and any references here are made solely for identification or informational purposes, without implying any affiliation, endorsement, or partnership.
We make no representations or warranties, express or implied, regarding the accuracy, completeness, or suitability of any content or products presented. Nothing on this website should be construed as legal, tax, investment, financial, medical, or other professional advice. In addition, no part of this site—including articles or product references—constitutes a solicitation, recommendation, endorsement, advertisement, or offer to buy or sell any securities, franchises, or other financial instruments, particularly in jurisdictions where such activity would be unlawful.
All content is of a general nature and may not address the specific circumstances of any individual or entity. It is not a substitute for professional advice or services. Any actions you take based on the information provided here are strictly at your own risk. You accept full responsibility for any decisions or outcomes arising from your use of this website and agree to release us from any liability in connection with your use of, or reliance upon, the content or products found herein.