
|
Cleanspark, Inc. (CLSK) DCF -Bewertung |
Fully Editable: Tailor To Your Needs In Excel Or Sheets
Professional Design: Trusted, Industry-Standard Templates
Investor-Approved Valuation Models
MAC/PC Compatible, Fully Unlocked
No Expertise Is Needed; Easy To Follow
CleanSpark, Inc. (CLSK) Bundle
Vereinfachen Sie die Bewertung von CleanSpark, Inc. (CLSK) mit diesem anpassbaren DCF -Taschenrechner! Mit Real Cleanspark, Inc. (CLSK) Finanzdaten und einstellbaren Prognoseeingaben können Sie Szenarien testen und Cleanspark, Inc. (CLSK) in Minuten aufdecken.
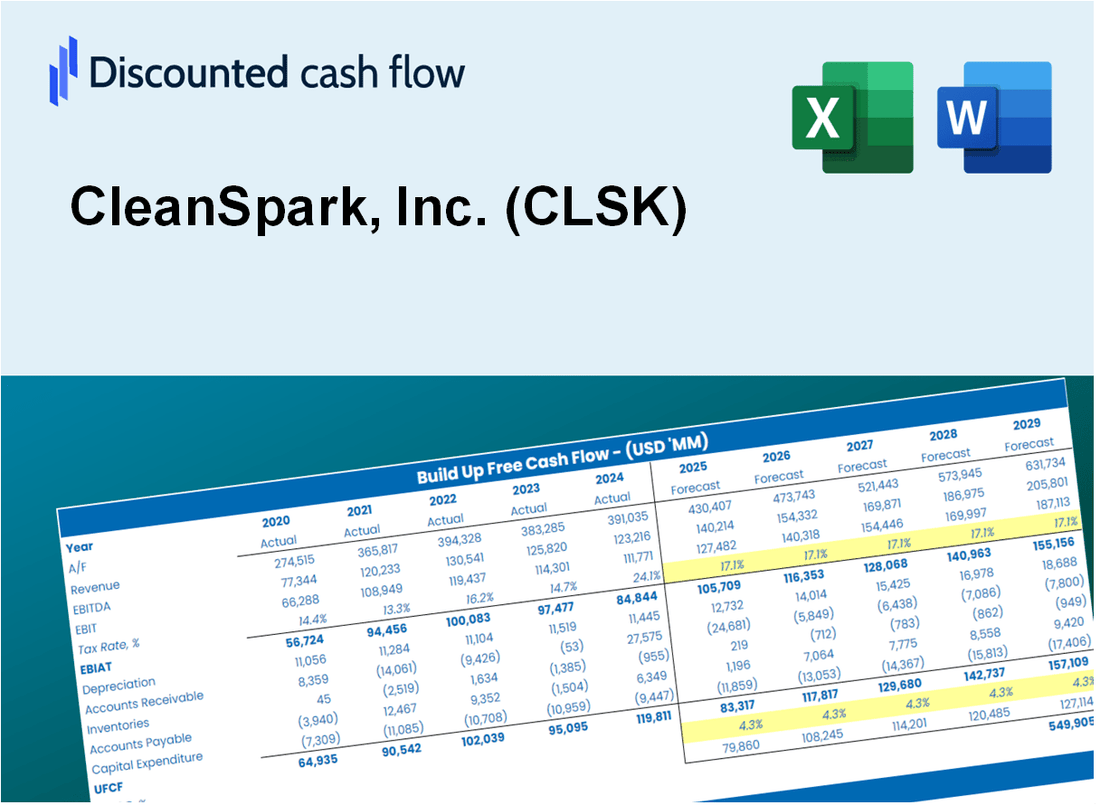
Discounted Cash Flow (DCF) - (USD MM)
| Year | AY1 2020 |
AY2 2021 |
AY3 2022 |
AY4 2023 |
AY5 2024 |
FY1 2025 |
FY2 2026 |
FY3 2027 |
FY4 2028 |
FY5 2029 |
|---|---|---|---|---|---|---|---|---|---|---|
| Revenue | 10.0 | 39.3 | 131.5 | 168.4 | 379.0 | 689.8 | 1,255.4 | 2,285.0 | 4,159.0 | 7,569.8 |
| Revenue Growth, % | 0 | 291.73 | 234.78 | 28.04 | 125.03 | 82.01 | 82.01 | 82.01 | 82.01 | 82.01 |
| EBITDA | -9.8 | 1.3 | 10.0 | -7.6 | 14.6 | -120.1 | -218.6 | -397.9 | -724.2 | -1,318.1 |
| EBITDA, % | -97.23 | 3.19 | 7.63 | -4.51 | 3.86 | -17.41 | -17.41 | -17.41 | -17.41 | -17.41 |
| Depreciation | 2.8 | 9.3 | 49.0 | 120.7 | 154.6 | 278.4 | 506.7 | 922.3 | 1,678.7 | 3,055.5 |
| Depreciation, % | 28.28 | 23.77 | 37.29 | 71.69 | 40.8 | 40.36 | 40.36 | 40.36 | 40.36 | 40.36 |
| EBIT | -12.6 | -8.1 | -39.0 | -128.3 | -140.0 | -363.3 | -661.3 | -1,203.6 | -2,190.7 | -3,987.3 |
| EBIT, % | -125.51 | -20.57 | -29.66 | -76.2 | -36.94 | -52.67 | -52.67 | -52.67 | -52.67 | -52.67 |
| Total Cash | 4.1 | 38.9 | 32.2 | 86.2 | 553.8 | 435.2 | 792.2 | 1,441.9 | 2,624.4 | 4,776.7 |
| Total Cash, percent | .0 | .0 | .0 | .0 | .0 | .0 | .0 | .0 | .0 | .0 |
| Account Receivables | .9 | .3 | .0 | .0 | 140.0 | 64.0 | 116.4 | 211.9 | 385.7 | 702.0 |
| Account Receivables, % | 8.61 | 0.7816 | 0.02055047 | 0.00296898 | 36.95 | 9.27 | 9.27 | 9.27 | 9.27 | 9.27 |
| Inventories | .2 | .1 | .2 | .8 | .0 | 4.6 | 8.3 | 15.2 | 27.6 | 50.2 |
| Inventories, % | 2.47 | 0.20315 | 0.16453 | 0.48038 | 0 | 0.66318 | 0.66318 | 0.66318 | 0.66318 | 0.66318 |
| Accounts Payable | 4.5 | 7.0 | 24.7 | 65.6 | 83.0 | 196.6 | 357.8 | 651.2 | 1,185.3 | 2,157.4 |
| Accounts Payable, % | 45.14 | 17.77 | 18.75 | 38.94 | 21.9 | 28.5 | 28.5 | 28.5 | 28.5 | 28.5 |
| Capital Expenditure | -.1 | -228.6 | -190.7 | -300.9 | -806.4 | -553.5 | -1,007.4 | -1,833.5 | -3,337.1 | -6,074.0 |
| Capital Expenditure, % | -1.19 | -581.81 | -144.99 | -178.66 | -212.79 | -80.24 | -80.24 | -80.24 | -80.24 | -80.24 |
| Tax Rate, % | -2.35 | -2.35 | -2.35 | -2.35 | -2.35 | -2.35 | -2.35 | -2.35 | -2.35 | -2.35 |
| EBITAT | -12.6 | -21.4 | -55.8 | -135.0 | -143.3 | -363.3 | -661.3 | -1,203.6 | -2,190.7 | -3,987.3 |
| Depreciation | ||||||||||
| Changes in Account Receivables | ||||||||||
| Changes in Inventories | ||||||||||
| Changes in Accounts Payable | ||||||||||
| Capital Expenditure | ||||||||||
| UFCF | -6.5 | -237.5 | -179.6 | -274.8 | -916.9 | -453.3 | -1,056.9 | -1,923.7 | -3,501.3 | -6,372.7 |
| WACC, % | 21.1 | 21.1 | 21.1 | 21.1 | 21.1 | 21.1 | 21.1 | 21.1 | 21.1 | 21.1 |
| PV UFCF | ||||||||||
| SUM PV UFCF | -6,252.6 | |||||||||
| Long Term Growth Rate, % | 2.00 | |||||||||
| Free cash flow (T + 1) | -6,500 | |||||||||
| Terminal Value | -34,029 | |||||||||
| Present Terminal Value | -13,064 | |||||||||
| Enterprise Value | -19,317 | |||||||||
| Net Debt | -54 | |||||||||
| Equity Value | -19,263 | |||||||||
| Diluted Shares Outstanding, MM | 217 | |||||||||
| Equity Value Per Share | -88.82 |
What You Will Receive
- Authentic CLSK Financial Data: Pre-loaded with CleanSpark’s historical and projected figures for detailed analysis.
- Completely Customizable Template: Easily adjust key inputs such as revenue growth, WACC, and EBITDA %.
- Instant Calculations: Watch CleanSpark’s intrinsic value update in real-time as you make adjustments.
- Professional Valuation Tool: Tailored for investors, analysts, and consultants aiming for precise DCF outcomes.
- User-Friendly Interface: Streamlined layout and straightforward instructions suitable for all skill levels.
Key Features
- 🔍 Real-Life CLSK Financials: Pre-filled historical and projected data for CleanSpark, Inc.
- ✏️ Fully Customizable Inputs: Adjust all critical parameters (yellow cells) like WACC, growth %, and tax rates.
- 📊 Professional DCF Valuation: Built-in formulas calculate CleanSpark’s intrinsic value using the Discounted Cash Flow method.
- ⚡ Instant Results: Visualize CleanSpark’s valuation instantly after making changes.
- Scenario Analysis: Test and compare outcomes for various financial assumptions side-by-side.
How It Works
- Download: Get the pre-built Excel file containing CleanSpark, Inc.'s (CLSK) financial data.
- Customize: Modify forecasts such as revenue growth, EBITDA %, and WACC to fit your analysis.
- Update Automatically: Watch as intrinsic value and NPV calculations refresh in real-time.
- Test Scenarios: Generate various projections and instantly compare the results.
- Make Decisions: Leverage the valuation outcomes to inform your investment choices.
Why Choose This Calculator for CleanSpark, Inc. (CLSK)?
- User-Friendly Interface: Tailored for both novices and seasoned users.
- Customizable Inputs: Adjust parameters effortlessly to suit your evaluation needs.
- Real-Time Feedback: Observe immediate changes to CleanSpark’s valuation as you modify inputs.
- Preloaded Data: Comes with CleanSpark’s actual financial metrics for swift assessments.
- Relied Upon by Experts: Favored by investors and analysts for making strategic choices.
Who Should Use CleanSpark, Inc. (CLSK)?
- Investors: Gain insights into sustainable energy investments with a focus on profitability and growth.
- Financial Analysts: Utilize advanced analytics to assess CleanSpark's market position and financial health.
- Consultants: Quickly tailor reports and presentations on CleanSpark's operations and strategies for clients.
- Energy Enthusiasts: Enhance your knowledge of renewable energy solutions and their economic impacts.
- Educators and Students: Leverage real-world case studies from CleanSpark to enrich finance and sustainability curricula.
What the Template Contains
- Pre-Filled Data: Includes CleanSpark, Inc.'s (CLSK) historical financials and projections.
- Discounted Cash Flow Model: Editable DCF valuation model featuring automatic calculations.
- Weighted Average Cost of Capital (WACC): A specific sheet for calculating WACC based on user-defined inputs.
- Key Financial Ratios: Assess CleanSpark, Inc.'s (CLSK) profitability, efficiency, and leverage.
- Customizable Inputs: Easily modify revenue growth, margins, and tax rates.
- Clear Dashboard: Visualizations and tables summarizing essential valuation outcomes.
Disclaimer
All information, articles, and product details provided on this website are for general informational and educational purposes only. We do not claim any ownership over, nor do we intend to infringe upon, any trademarks, copyrights, logos, brand names, or other intellectual property mentioned or depicted on this site. Such intellectual property remains the property of its respective owners, and any references here are made solely for identification or informational purposes, without implying any affiliation, endorsement, or partnership.
We make no representations or warranties, express or implied, regarding the accuracy, completeness, or suitability of any content or products presented. Nothing on this website should be construed as legal, tax, investment, financial, medical, or other professional advice. In addition, no part of this site—including articles or product references—constitutes a solicitation, recommendation, endorsement, advertisement, or offer to buy or sell any securities, franchises, or other financial instruments, particularly in jurisdictions where such activity would be unlawful.
All content is of a general nature and may not address the specific circumstances of any individual or entity. It is not a substitute for professional advice or services. Any actions you take based on the information provided here are strictly at your own risk. You accept full responsibility for any decisions or outcomes arising from your use of this website and agree to release us from any liability in connection with your use of, or reliance upon, the content or products found herein.