
|
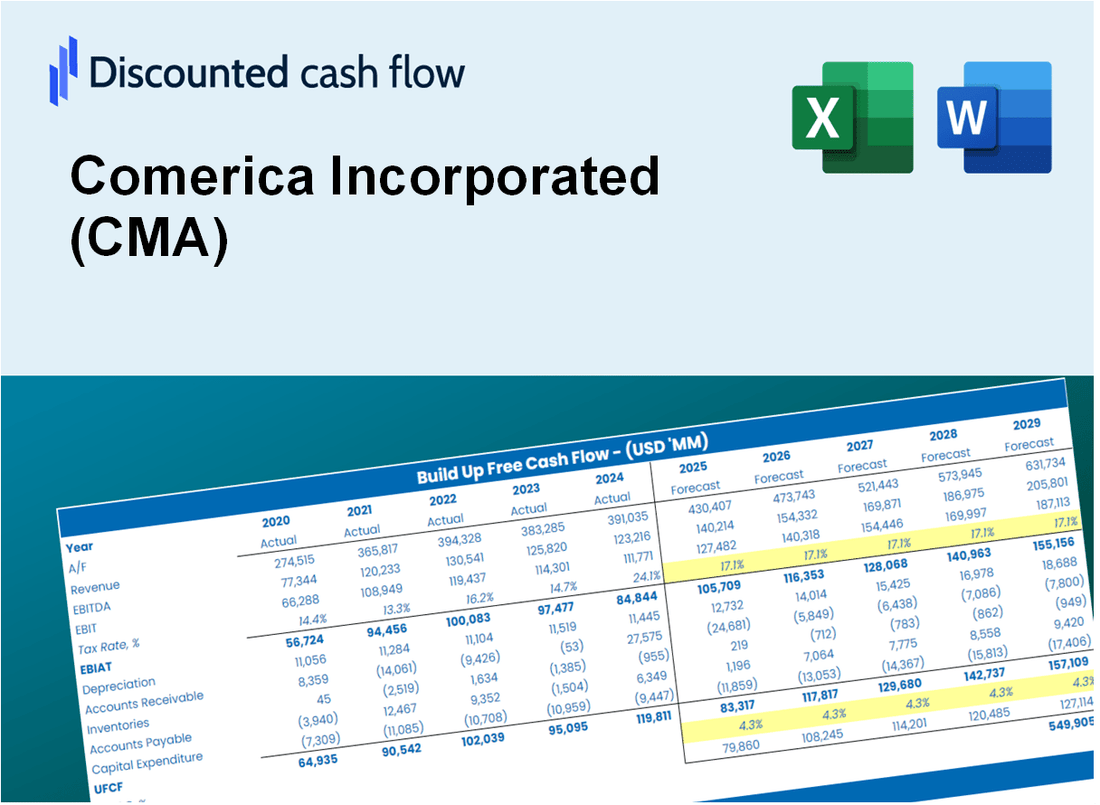
Comerica Incorporated (CMA) DCF -Bewertung |
Fully Editable: Tailor To Your Needs In Excel Or Sheets
Professional Design: Trusted, Industry-Standard Templates
Investor-Approved Valuation Models
MAC/PC Compatible, Fully Unlocked
No Expertise Is Needed; Easy To Follow
Comerica Incorporated (CMA) Bundle
Verbessern Sie Ihre Investitionsauswahl mit dem DCF -Taschenrechner von Comerica Incorporated (CMA)! Überprüfen Sie authentische Finanzdaten, ändern Sie Wachstumsvorhersagen und -kosten und beobachten Sie sofort, wie sich diese Anpassungen auf den inneren Wert von Comerica Incorporated (CMA) auswirken.
Discounted Cash Flow (DCF) - (USD MM)
| Year | AY1 2020 |
AY2 2021 |
AY3 2022 |
AY4 2023 |
AY5 2024 |
FY1 2025 |
FY2 2026 |
FY3 2027 |
FY4 2028 |
FY5 2029 |
|---|---|---|---|---|---|---|---|---|---|---|
| Revenue | 3,094.0 | 3,024.0 | 3,740.0 | 5,253.0 | 4,993.0 | 5,703.5 | 6,515.1 | 7,442.2 | 8,501.2 | 9,710.9 |
| Revenue Growth, % | 0 | -2.26 | 23.68 | 40.45 | -4.95 | 14.23 | 14.23 | 14.23 | 14.23 | 14.23 |
| EBITDA | 729.0 | 1,589.0 | 1,568.0 | 1,231.0 | 984.0 | 1,838.5 | 2,100.1 | 2,399.0 | 2,740.4 | 3,130.3 |
| EBITDA, % | 23.56 | 52.55 | 41.93 | 23.43 | 19.71 | 32.23 | 32.23 | 32.23 | 32.23 | 32.23 |
| Depreciation | 108.0 | 99.0 | 92.0 | 87.0 | 96.0 | 146.0 | 166.8 | 190.6 | 217.7 | 248.7 |
| Depreciation, % | 3.49 | 3.27 | 2.46 | 1.66 | 1.92 | 2.56 | 2.56 | 2.56 | 2.56 | 2.56 |
| EBIT | 621.0 | 1,490.0 | 1,476.0 | 1,144.0 | 888.0 | 1,692.5 | 1,933.3 | 2,208.4 | 2,522.7 | 2,881.7 |
| EBIT, % | 20.07 | 49.27 | 39.47 | 21.78 | 17.78 | 29.67 | 29.67 | 29.67 | 29.67 | 29.67 |
| Total Cash | 30,967.0 | 39,862.0 | 25,451.0 | 26,770.0 | 14,179.0 | 5,703.5 | 6,515.1 | 7,442.2 | 8,501.2 | 9,710.9 |
| Total Cash, percent | .0 | .0 | .0 | .0 | .0 | .0 | .0 | .0 | .0 | .0 |
| Account Receivables | 584.0 | 634.0 | 754.0 | 795.0 | 709.0 | 1,019.0 | 1,164.1 | 1,329.7 | 1,518.9 | 1,735.1 |
| Account Receivables, % | 18.88 | 20.97 | 20.16 | 15.13 | 14.2 | 17.87 | 17.87 | 17.87 | 17.87 | 17.87 |
| Inventories | .0 | .0 | .0 | .0 | .0 | .0 | .0 | .0 | .0 | .0 |
| Inventories, % | 0 | 0 | 0 | 0 | 0 | 0 | 0 | 0 | 0 | 0 |
| Accounts Payable | .0 | .0 | .0 | .0 | .0 | .0 | .0 | .0 | .0 | .0 |
| Accounts Payable, % | 0 | 0 | 0 | 0 | 0 | 0 | 0 | 0 | 0 | 0 |
| Capital Expenditure | -79.0 | -70.0 | -82.0 | -153.0 | -153.0 | -148.7 | -169.9 | -194.1 | -221.7 | -253.2 |
| Capital Expenditure, % | -2.55 | -2.31 | -2.19 | -2.91 | -3.06 | -2.61 | -2.61 | -2.61 | -2.61 | -2.61 |
| Tax Rate, % | 21.4 | 21.4 | 21.4 | 21.4 | 21.4 | 21.4 | 21.4 | 21.4 | 21.4 | 21.4 |
| EBITAT | 497.0 | 1,168.0 | 1,151.0 | 881.0 | 698.0 | 1,327.0 | 1,515.8 | 1,731.5 | 1,977.9 | 2,259.3 |
| Depreciation | ||||||||||
| Changes in Account Receivables | ||||||||||
| Changes in Inventories | ||||||||||
| Changes in Accounts Payable | ||||||||||
| Capital Expenditure | ||||||||||
| UFCF | -58.0 | 1,147.0 | 1,041.0 | 774.0 | 727.0 | 1,014.2 | 1,367.7 | 1,562.3 | 1,784.7 | 2,038.6 |
| WACC, % | 13.56 | 13.39 | 13.35 | 13.25 | 13.41 | 13.39 | 13.39 | 13.39 | 13.39 | 13.39 |
| PV UFCF | ||||||||||
| SUM PV UFCF | 5,196.6 | |||||||||
| Long Term Growth Rate, % | 2.00 | |||||||||
| Free cash flow (T + 1) | 2,079 | |||||||||
| Terminal Value | 18,251 | |||||||||
| Present Terminal Value | 9,735 | |||||||||
| Enterprise Value | 14,932 | |||||||||
| Net Debt | -131 | |||||||||
| Equity Value | 15,063 | |||||||||
| Diluted Shares Outstanding, MM | 134 | |||||||||
| Equity Value Per Share | 112.41 |
What You Will Get
- Real CMA Financials: Access to both historical and projected data for precise valuation.
- Customizable Inputs: Adjust WACC, tax rates, revenue growth, and capital expenditures as needed.
- Dynamic Calculations: Intrinsic value and NPV are computed in real-time.
- Scenario Analysis: Evaluate multiple scenarios to assess Comerica's future performance.
- User-Friendly Interface: Designed for professionals while remaining approachable for newcomers.
Key Features
- Customizable Financial Inputs: Adjust essential parameters such as loan growth, net interest margin, and operating expenses.
- Instant DCF Valuation: Quickly computes intrinsic value, NPV, and other financial metrics.
- High-Precision Analysis: Leverages Comerica’s actual financial data for accurate valuation results.
- Effortless Scenario Testing: Evaluate various assumptions and analyze results with ease.
- Efficiency Booster: Remove the hassle of constructing intricate valuation models from the ground up.
How It Works
- Step 1: Download the Excel file.
- Step 2: Review pre-entered Comerica Incorporated (CMA) data (historical and projected).
- Step 3: Adjust key assumptions (yellow cells) based on your analysis.
- Step 4: View automatic recalculations for Comerica Incorporated (CMA)’s intrinsic value.
- Step 5: Use the outputs for investment decisions or reporting.
Why Choose This Calculator for Comerica Incorporated (CMA)?
- Accuracy: Utilizes real Comerica financials for precise data representation.
- Flexibility: Tailored for users to easily adjust and test various inputs.
- Time-Saving: Avoid the complexities of constructing a DCF model from the ground up.
- Professional-Grade: Crafted with the expertise and usability expected at the CFO level.
- User-Friendly: Intuitive design ensures accessibility for users without extensive financial modeling skills.
Who Should Use This Product?
- Investors: Evaluate Comerica Incorporated’s (CMA) performance before making investment decisions.
- CFOs and Financial Analysts: Enhance valuation methodologies and assess financial forecasts for Comerica Incorporated.
- Startup Founders: Discover the valuation strategies employed by established banks like Comerica Incorporated.
- Consultants: Provide detailed valuation analyses and reports for clients involving Comerica Incorporated.
- Students and Educators: Utilize real-time data from Comerica Incorporated to learn and teach valuation principles.
What the Template Contains
- Operating and Balance Sheet Data: Pre-filled Comerica Incorporated (CMA) historical data and forecasts, including revenue, EBITDA, EBIT, and capital expenditures.
- WACC Calculation: A dedicated sheet for Weighted Average Cost of Capital (WACC), featuring parameters such as Beta, risk-free rate, and share price.
- DCF Valuation (Unlevered and Levered): Editable Discounted Cash Flow models presenting intrinsic value with comprehensive calculations.
- Financial Statements: Pre-loaded financial statements (annual and quarterly) to facilitate analysis.
- Key Ratios: Includes profitability, leverage, and efficiency ratios for Comerica Incorporated (CMA).
- Dashboard and Charts: Visual summary of valuation outputs and assumptions for easy result analysis.
Disclaimer
All information, articles, and product details provided on this website are for general informational and educational purposes only. We do not claim any ownership over, nor do we intend to infringe upon, any trademarks, copyrights, logos, brand names, or other intellectual property mentioned or depicted on this site. Such intellectual property remains the property of its respective owners, and any references here are made solely for identification or informational purposes, without implying any affiliation, endorsement, or partnership.
We make no representations or warranties, express or implied, regarding the accuracy, completeness, or suitability of any content or products presented. Nothing on this website should be construed as legal, tax, investment, financial, medical, or other professional advice. In addition, no part of this site—including articles or product references—constitutes a solicitation, recommendation, endorsement, advertisement, or offer to buy or sell any securities, franchises, or other financial instruments, particularly in jurisdictions where such activity would be unlawful.
All content is of a general nature and may not address the specific circumstances of any individual or entity. It is not a substitute for professional advice or services. Any actions you take based on the information provided here are strictly at your own risk. You accept full responsibility for any decisions or outcomes arising from your use of this website and agree to release us from any liability in connection with your use of, or reliance upon, the content or products found herein.