|
Columbus McKinnon Corporation (CMCO) DCF -Bewertung |
Fully Editable: Tailor To Your Needs In Excel Or Sheets
Professional Design: Trusted, Industry-Standard Templates
Investor-Approved Valuation Models
MAC/PC Compatible, Fully Unlocked
No Expertise Is Needed; Easy To Follow
Columbus McKinnon Corporation (CMCO) Bundle
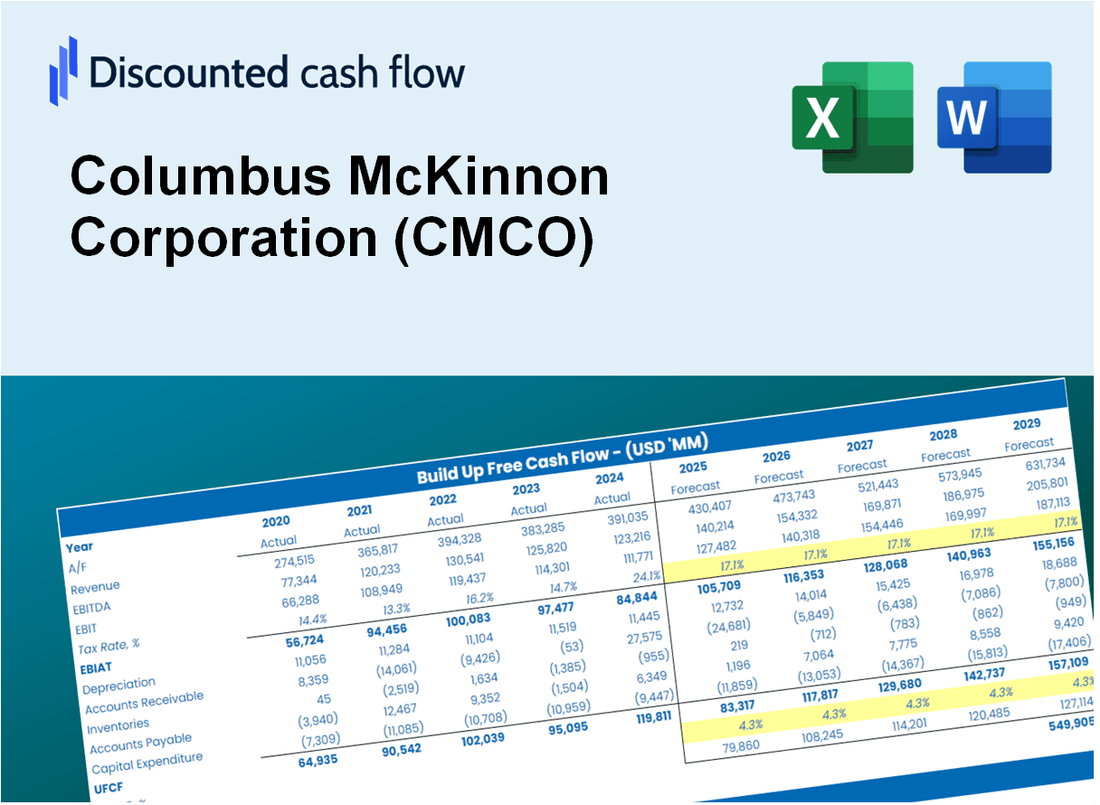
Entdecken Sie das wahre Potenzial der Columbus McKinnon Corporation (CMCO) mit unserem fortschrittlichen DCF -Taschenrechner! Passen Sie kritische Annahmen an, erkunden Sie verschiedene Szenarien und bewerten Sie, wie sich unterschiedliche Faktoren auswirken, wie die Bewertung der Columbus McKinnon Corporation (CMCO) - alles innerhalb einer umfassenden Excel -Vorlage.
What You Will Get
- Real CMCO Financials: Includes historical and forecasted data for precise valuation.
- Adjustable Inputs: Customize WACC, tax rates, revenue growth, and capital expenditures.
- Automatic Calculations: Intrinsic value and NPV are computed dynamically.
- Scenario Analysis: Evaluate multiple scenarios to assess Columbus McKinnon's future performance.
- Clear and Intuitive Design: Designed for professionals while remaining user-friendly for beginners.
Key Features
- Comprehensive DCF Calculator: Features detailed unlevered and levered DCF valuation models tailored for Columbus McKinnon Corporation (CMCO).
- WACC Calculator: Pre-configured Weighted Average Cost of Capital sheet with adjustable inputs specific to CMCO.
- Customizable Forecast Assumptions: Adjust growth rates, capital expenditures, and discount rates according to CMCO's performance.
- Integrated Financial Ratios: Evaluate profitability, leverage, and efficiency ratios relevant to Columbus McKinnon Corporation (CMCO).
- Interactive Dashboard and Charts: Visual representations summarize essential valuation metrics for straightforward analysis of CMCO.
How It Works
- Step 1: Download the Excel file for Columbus McKinnon Corporation (CMCO).
- Step 2: Review CMCO's pre-filled financial data and forecasts.
- Step 3: Modify key inputs such as revenue growth, WACC, and tax rates (highlighted cells).
- Step 4: Observe the DCF model update in real-time as you adjust assumptions.
- Step 5: Evaluate the outputs and utilize the findings for your investment decisions.
Why Choose This Calculator?
- Designed for Experts: A sophisticated tool utilized by analysts, CFOs, and industry consultants.
- Accurate Data: Columbus McKinnon Corporation’s (CMCO) historical and projected financials are preloaded for precision.
- Flexible Scenario Analysis: Easily simulate various forecasts and assumptions.
- Comprehensive Outputs: Instantly calculates intrinsic value, NPV, and essential metrics.
- User-Friendly: Step-by-step guidance ensures a smooth experience throughout the process.
Who Should Use This Product?
- Engineering Students: Explore mechanical design principles and apply them with real-world examples.
- Researchers: Utilize advanced lifting solutions in your studies or projects.
- Manufacturers: Assess your production needs and evaluate equipment options for Columbus McKinnon Corporation (CMCO).
- Supply Chain Analysts: Optimize operations with a comprehensive understanding of material handling solutions.
- Facility Managers: Learn how to implement safety and efficiency improvements in your operations.
What the Template Contains
- Pre-Filled DCF Model: Columbus McKinnon Corporation’s (CMCO) financial data preloaded for immediate use.
- WACC Calculator: Detailed calculations for Weighted Average Cost of Capital.
- Financial Ratios: Evaluate Columbus McKinnon’s (CMCO) profitability, leverage, and efficiency.
- Editable Inputs: Change assumptions such as growth, margins, and CAPEX to fit your scenarios.
- Financial Statements: Annual and quarterly reports to support detailed analysis.
- Interactive Dashboard: Easily visualize key valuation metrics and results.
Disclaimer
All information, articles, and product details provided on this website are for general informational and educational purposes only. We do not claim any ownership over, nor do we intend to infringe upon, any trademarks, copyrights, logos, brand names, or other intellectual property mentioned or depicted on this site. Such intellectual property remains the property of its respective owners, and any references here are made solely for identification or informational purposes, without implying any affiliation, endorsement, or partnership.
We make no representations or warranties, express or implied, regarding the accuracy, completeness, or suitability of any content or products presented. Nothing on this website should be construed as legal, tax, investment, financial, medical, or other professional advice. In addition, no part of this site—including articles or product references—constitutes a solicitation, recommendation, endorsement, advertisement, or offer to buy or sell any securities, franchises, or other financial instruments, particularly in jurisdictions where such activity would be unlawful.
All content is of a general nature and may not address the specific circumstances of any individual or entity. It is not a substitute for professional advice or services. Any actions you take based on the information provided here are strictly at your own risk. You accept full responsibility for any decisions or outcomes arising from your use of this website and agree to release us from any liability in connection with your use of, or reliance upon, the content or products found herein.