
|
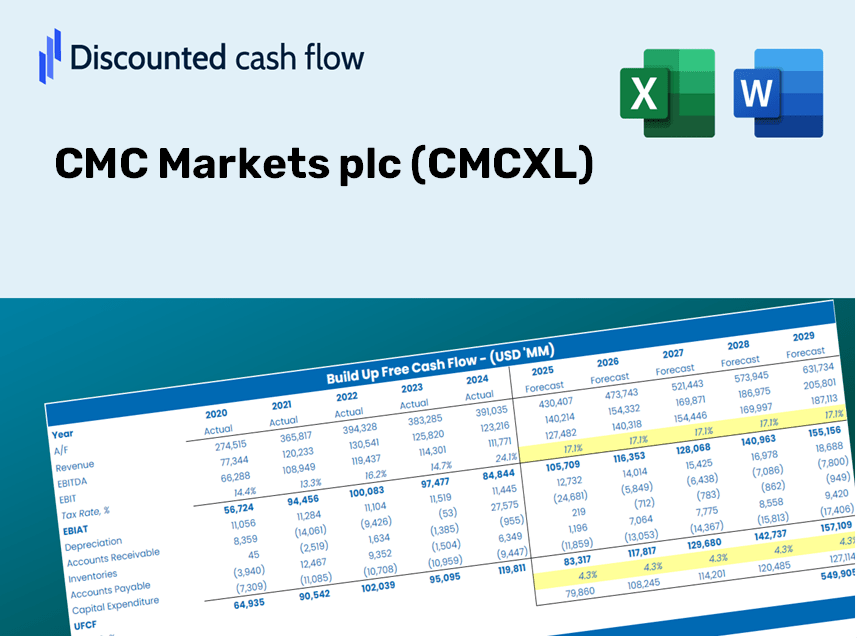
CMC Markets Plc (CMCX.L) DCF -Bewertung |
Fully Editable: Tailor To Your Needs In Excel Or Sheets
Professional Design: Trusted, Industry-Standard Templates
Investor-Approved Valuation Models
MAC/PC Compatible, Fully Unlocked
No Expertise Is Needed; Easy To Follow
CMC Markets plc (CMCX.L) Bundle
Entdecken Sie das wahre Potenzial von CMC Markets Plc mit unserem DCF-Taschenrechner von Professional Grade! Passen Sie die wichtigsten Annahmen an, erkunden Sie verschiedene Szenarien und bewerten Sie, wie sich Änderungen auf die Bewertung der CMC Markets PLC auswirken - alles innerhalb einer Excel -Vorlage.
Discounted Cash Flow (DCF) - (USD MM)
| Year | AY1 2020 |
AY2 2021 |
AY3 2022 |
AY4 2023 |
AY5 2024 |
FY1 2025 |
FY2 2026 |
FY3 2027 |
FY4 2028 |
FY5 2029 |
|---|---|---|---|---|---|---|---|---|---|---|
| Revenue | 455.5 | 323.9 | 322.2 | 359.7 | 360.1 | 344.2 | 329.0 | 314.5 | 300.6 | 287.3 |
| Revenue Growth, % | 0 | -28.9 | -0.52153 | 11.66 | 0.09840304 | -4.42 | -4.42 | -4.42 | -4.42 | -4.42 |
| EBITDA | 236.8 | 113.7 | 77.5 | 92.7 | 100.4 | 113.4 | 108.4 | 103.6 | 99.1 | 94.7 |
| EBITDA, % | 51.98 | 35.11 | 24.05 | 25.77 | 27.87 | 32.96 | 32.96 | 32.96 | 32.96 | 32.96 |
| Depreciation | 11.2 | 12.4 | 15.6 | 27.4 | 14.0 | 15.6 | 14.9 | 14.3 | 13.6 | 13.0 |
| Depreciation, % | 2.47 | 3.83 | 4.85 | 7.62 | 3.89 | 4.53 | 4.53 | 4.53 | 4.53 | 4.53 |
| EBIT | 225.6 | 101.3 | 61.8 | 65.3 | 86.4 | 97.8 | 93.5 | 89.4 | 85.4 | 81.7 |
| EBIT, % | 49.52 | 31.28 | 19.2 | 18.15 | 23.98 | 28.42 | 28.42 | 28.42 | 28.42 | 28.42 |
| Total Cash | 147.0 | 191.1 | 176.8 | 211.2 | 328.2 | 203.8 | 194.8 | 186.2 | 178.0 | 170.1 |
| Total Cash, percent | .0 | .0 | .0 | .0 | .0 | .0 | .0 | .0 | .0 | .0 |
| Account Receivables | 374.8 | 349.4 | 313.2 | 378.3 | 269.1 | 312.7 | 298.9 | 285.7 | 273.1 | 261.0 |
| Account Receivables, % | 82.27 | 107.89 | 97.21 | 105.15 | 74.72 | 90.84 | 90.84 | 90.84 | 90.84 | 90.84 |
| Inventories | .0 | .0 | .0 | -.9 | .0 | -.2 | -.2 | -.2 | -.1 | -.1 |
| Inventories, % | 0 | 0 | 0 | -0.24795 | 0 | -0.04959068 | -0.04959068 | -0.04959068 | -0.04959068 | -0.04959068 |
| Accounts Payable | 119.8 | 168.0 | 147.8 | 235.6 | 217.4 | 172.0 | 164.4 | 157.2 | 150.2 | 143.6 |
| Accounts Payable, % | 26.29 | 51.88 | 45.89 | 65.5 | 60.36 | 49.98 | 49.98 | 49.98 | 49.98 | 49.98 |
| Capital Expenditure | -12.2 | -15.8 | -28.2 | -19.9 | -9.1 | -16.8 | -16.0 | -15.3 | -14.7 | -14.0 |
| Capital Expenditure, % | -2.68 | -4.88 | -8.76 | -5.53 | -2.53 | -4.87 | -4.87 | -4.87 | -4.87 | -4.87 |
| Tax Rate, % | 26.37 | 26.37 | 26.37 | 26.37 | 26.37 | 26.37 | 26.37 | 26.37 | 26.37 | 26.37 |
| EBITAT | 179.3 | 79.1 | 49.1 | 48.3 | 63.6 | 75.3 | 72.0 | 68.8 | 65.7 | 62.8 |
| Depreciation | ||||||||||
| Changes in Account Receivables | ||||||||||
| Changes in Inventories | ||||||||||
| Changes in Accounts Payable | ||||||||||
| Capital Expenditure | ||||||||||
| UFCF | -76.6 | 149.3 | 52.6 | 79.5 | 158.6 | -14.7 | 77.0 | 73.6 | 70.4 | 67.3 |
| WACC, % | 7.04 | 7.04 | 7.04 | 7.02 | 7.02 | 7.03 | 7.03 | 7.03 | 7.03 | 7.03 |
| PV UFCF | ||||||||||
| SUM PV UFCF | 215.1 | |||||||||
| Long Term Growth Rate, % | 2.00 | |||||||||
| Free cash flow (T + 1) | 69 | |||||||||
| Terminal Value | 1,363 | |||||||||
| Present Terminal Value | 970 | |||||||||
| Enterprise Value | 1,185 | |||||||||
| Net Debt | -233 | |||||||||
| Equity Value | 1,419 | |||||||||
| Diluted Shares Outstanding, MM | 275 | |||||||||
| Equity Value Per Share | 515.49 |
Benefits You Will Receive
- Flexible Forecast Inputs: Modify key assumptions (growth %, margins, WACC) effortlessly to explore various scenarios.
- Comprehensive Data: CMC Markets plc’s (CMCXL) financial data pre-loaded to expedite your analysis.
- Automated DCF Outputs: The template computes Net Present Value (NPV) and intrinsic value automatically for your convenience.
- Tailored and Professional: A refined Excel model designed to meet your valuation requirements.
- Designed for Analysts and Investors: Perfect for evaluating forecasts, affirming strategies, and enhancing efficiency.
Key Features
- Real-Life CMC Data: Pre-populated with CMC Markets' historical performance metrics and future growth estimates.
- Fully Customizable Inputs: Tailor revenue growth rates, profit margins, discount rates, tax assumptions, and capital expenditures to your needs.
- Dynamic Valuation Model: NPV and intrinsic value automatically refresh based on your customized inputs.
- Scenario Analysis: Develop various forecasting scenarios to evaluate different valuation possibilities.
- User-Friendly Interface: Intuitive and organized, catering to both experienced professionals and newcomers.
How It Functions
- Step 1: Download the Excel spreadsheet.
- Step 2: Examine the pre-filled CMC Markets data (historical and projected).
- Step 3: Modify key assumptions (highlighted in yellow) according to your analysis.
- Step 4: Observe automatic recalculations for CMC Markets' intrinsic value.
- Step 5: Utilize the results for investment choices or reporting purposes.
Why Opt for This Calculator?
- Precise Data: Access authentic CMC Markets plc financials for dependable valuation outcomes.
- Adjustable: Tailor crucial factors such as growth rates, WACC, and tax rates to suit your forecasts.
- Efficient: Ready-made calculations save you the hassle of starting from the ground up.
- Expert-Grade Tool: Crafted for investors, analysts, and financial consultants.
- Easy to Use: Intuitive design and clear, step-by-step guidance make it accessible for everyone.
Who Should Use This Product?
- Investors: Effectively assess CMC Markets plc's (CMCXL) fair value prior to making investment choices.
- CFOs: Utilize a high-quality DCF model for accurate financial reporting and analysis.
- Consultants: Easily customize the template for client valuation reports.
- Entrepreneurs: Obtain valuable insights into the financial modeling practices of leading firms.
- Educators: Employ it as a resource to illustrate various valuation methodologies.
Contents of the Template
- Operating and Balance Sheet Data: Pre-filled historical data and forecasts for CMC Markets plc (CMCXL), covering metrics such as revenue, EBITDA, EBIT, and capital expenditures.
- WACC Calculation: A dedicated sheet for calculating the Weighted Average Cost of Capital (WACC), featuring essential parameters like Beta, risk-free rate, and share price.
- DCF Valuation (Unlevered and Levered): Customizable Discounted Cash Flow models illustrating intrinsic value with comprehensive calculations.
- Financial Statements: Pre-populated annual and quarterly financial statements to facilitate thorough analysis.
- Key Ratios: Includes critical profitability, leverage, and efficiency ratios specific to CMC Markets plc (CMCXL).
- Dashboard and Charts: A visual summary showcasing valuation outputs and assumptions for easier result analysis.
Disclaimer
All information, articles, and product details provided on this website are for general informational and educational purposes only. We do not claim any ownership over, nor do we intend to infringe upon, any trademarks, copyrights, logos, brand names, or other intellectual property mentioned or depicted on this site. Such intellectual property remains the property of its respective owners, and any references here are made solely for identification or informational purposes, without implying any affiliation, endorsement, or partnership.
We make no representations or warranties, express or implied, regarding the accuracy, completeness, or suitability of any content or products presented. Nothing on this website should be construed as legal, tax, investment, financial, medical, or other professional advice. In addition, no part of this site—including articles or product references—constitutes a solicitation, recommendation, endorsement, advertisement, or offer to buy or sell any securities, franchises, or other financial instruments, particularly in jurisdictions where such activity would be unlawful.
All content is of a general nature and may not address the specific circumstances of any individual or entity. It is not a substitute for professional advice or services. Any actions you take based on the information provided here are strictly at your own risk. You accept full responsibility for any decisions or outcomes arising from your use of this website and agree to release us from any liability in connection with your use of, or reliance upon, the content or products found herein.