
|
Cummins Inc. (CMI) DCF -Bewertung |
Fully Editable: Tailor To Your Needs In Excel Or Sheets
Professional Design: Trusted, Industry-Standard Templates
Investor-Approved Valuation Models
MAC/PC Compatible, Fully Unlocked
No Expertise Is Needed; Easy To Follow
Cummins Inc. (CMI) Bundle
Entdecken Sie den wahren Wert von Cummins Inc. (CMI) mit unserem fortschrittlichen DCF -Taschenrechner! Passen Sie wesentliche Annahmen an, erkunden Sie verschiedene Szenarien und untersuchen, wie sich Schwankungen auf die Bewertung der Cummins Inc. (CMI) auswirken - alles innerhalb einer einzelnen Excel -Vorlage.
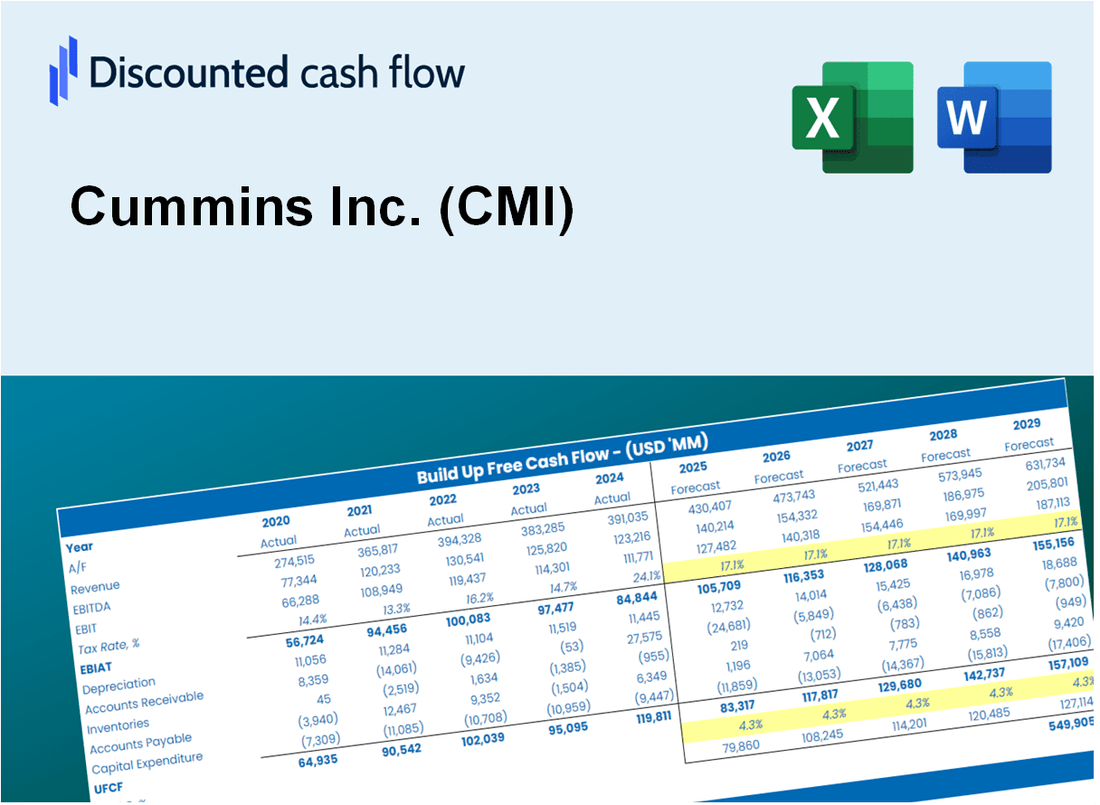
Discounted Cash Flow (DCF) - (USD MM)
| Year | AY1 2020 |
AY2 2021 |
AY3 2022 |
AY4 2023 |
AY5 2024 |
FY1 2025 |
FY2 2026 |
FY3 2027 |
FY4 2028 |
FY5 2029 |
|---|---|---|---|---|---|---|---|---|---|---|
| Revenue | 19,811.0 | 24,021.0 | 28,074.0 | 34,065.0 | 34,102.0 | 39,180.8 | 45,016.0 | 51,720.3 | 59,423.0 | 68,272.9 |
| Revenue Growth, % | 0 | 21.25 | 16.87 | 21.34 | 0.10862 | 14.89 | 14.89 | 14.89 | 14.89 | 14.89 |
| EBITDA | 3,111.0 | 3,524.0 | 3,802.0 | 3,025.0 | 6,338.0 | 5,593.6 | 6,426.7 | 7,383.8 | 8,483.5 | 9,746.9 |
| EBITDA, % | 15.7 | 14.67 | 13.54 | 8.88 | 18.59 | 14.28 | 14.28 | 14.28 | 14.28 | 14.28 |
| Depreciation | 673.0 | 662.0 | 784.0 | 1,024.0 | 1,065.0 | 1,181.3 | 1,357.2 | 1,559.3 | 1,791.6 | 2,058.4 |
| Depreciation, % | 3.4 | 2.76 | 2.79 | 3.01 | 3.12 | 3.01 | 3.01 | 3.01 | 3.01 | 3.01 |
| EBIT | 2,438.0 | 2,862.0 | 3,018.0 | 2,001.0 | 5,273.0 | 4,412.4 | 5,069.5 | 5,824.5 | 6,691.9 | 7,688.6 |
| EBIT, % | 12.31 | 11.91 | 10.75 | 5.87 | 15.46 | 11.26 | 11.26 | 11.26 | 11.26 | 11.26 |
| Total Cash | 3,862.0 | 3,187.0 | 2,573.0 | 2,741.0 | 2,264.0 | 4,436.2 | 5,096.9 | 5,856.0 | 6,728.1 | 7,730.2 |
| Total Cash, percent | .0 | .0 | .0 | .0 | .0 | .0 | .0 | .0 | .0 | .0 |
| Account Receivables | 3,820.0 | 3,990.0 | 5,202.0 | 5,583.0 | 5,181.0 | 6,739.4 | 7,743.1 | 8,896.3 | 10,221.3 | 11,743.5 |
| Account Receivables, % | 19.28 | 16.61 | 18.53 | 16.39 | 15.19 | 17.2 | 17.2 | 17.2 | 17.2 | 17.2 |
| Inventories | 3,425.0 | 4,355.0 | 5,603.0 | 5,677.0 | 5,742.0 | 6,964.7 | 8,002.0 | 9,193.7 | 10,562.9 | 12,136.1 |
| Inventories, % | 17.29 | 18.13 | 19.96 | 16.67 | 16.84 | 17.78 | 17.78 | 17.78 | 17.78 | 17.78 |
| Accounts Payable | 2,820.0 | 3,021.0 | 4,252.0 | 4,260.0 | 3,951.0 | 5,175.6 | 5,946.4 | 6,832.0 | 7,849.6 | 9,018.6 |
| Accounts Payable, % | 14.23 | 12.58 | 15.15 | 12.51 | 11.59 | 13.21 | 13.21 | 13.21 | 13.21 | 13.21 |
| Capital Expenditure | -575.0 | -786.0 | -916.0 | -1,213.0 | -1,208.0 | -1,296.1 | -1,489.2 | -1,711.0 | -1,965.8 | -2,258.5 |
| Capital Expenditure, % | -2.9 | -3.27 | -3.26 | -3.56 | -3.54 | -3.31 | -3.31 | -3.31 | -3.31 | -3.31 |
| Tax Rate, % | 19.52 | 19.52 | 19.52 | 19.52 | 19.52 | 19.52 | 19.52 | 19.52 | 19.52 | 19.52 |
| EBITAT | 1,865.5 | 2,217.0 | 2,302.8 | 904.5 | 4,243.8 | 3,141.3 | 3,609.2 | 4,146.7 | 4,764.2 | 5,473.8 |
| Depreciation | ||||||||||
| Changes in Account Receivables | ||||||||||
| Changes in Inventories | ||||||||||
| Changes in Accounts Payable | ||||||||||
| Capital Expenditure | ||||||||||
| UFCF | -2,461.5 | 1,194.0 | 941.8 | 268.5 | 4,128.8 | 1,469.9 | 2,207.0 | 2,535.7 | 2,913.4 | 3,347.3 |
| WACC, % | 8.45 | 8.45 | 8.45 | 8.29 | 8.47 | 8.42 | 8.42 | 8.42 | 8.42 | 8.42 |
| PV UFCF | ||||||||||
| SUM PV UFCF | 9,565.0 | |||||||||
| Long Term Growth Rate, % | 2.00 | |||||||||
| Free cash flow (T + 1) | 3,414 | |||||||||
| Terminal Value | 53,161 | |||||||||
| Present Terminal Value | 35,481 | |||||||||
| Enterprise Value | 45,046 | |||||||||
| Net Debt | 5,927 | |||||||||
| Equity Value | 39,119 | |||||||||
| Diluted Shares Outstanding, MM | 139 | |||||||||
| Equity Value Per Share | 281.23 |
What You Will Receive
- Pre-Filled Financial Model: Cummins Inc.'s actual data allows for accurate DCF valuation.
- Comprehensive Forecast Control: Modify revenue growth, profit margins, WACC, and other crucial factors.
- Real-Time Calculations: Automatic updates provide immediate feedback as you make adjustments.
- Professional-Grade Template: A polished Excel file crafted for high-quality valuation.
- Adaptable and Reusable: Designed for versatility, enabling ongoing use for in-depth forecasts.
Key Features
- Real-Time CMI Data: Pre-loaded with Cummins Inc.'s historical financial data and future projections.
- Comprehensive Customization Options: Modify revenue growth, profit margins, WACC, tax rates, and capital expenditures as needed.
- Interactive Valuation Model: Instant updates to Net Present Value (NPV) and intrinsic value based on your adjustments.
- Scenario Analysis: Develop various forecast scenarios to evaluate different valuation results.
- Intuitive User Interface: Designed to be straightforward and accessible for both professionals and newcomers.
How It Works
- 1. Access the Template: Download and open the Excel file containing Cummins Inc.'s (CMI) preloaded data.
- 2. Modify Assumptions: Adjust key inputs such as growth rates, WACC, and capital expenditures.
- 3. See Results Immediately: The DCF model automatically computes intrinsic value and NPV.
- 4. Explore Scenarios: Evaluate various forecasts to examine different valuation results.
- 5. Present with Assurance: Deliver professional valuation insights to back your decisions.
Why Choose This Calculator for Cummins Inc. (CMI)?
- Designed for Industry Experts: A sophisticated tool utilized by financial analysts, CFOs, and industry consultants.
- Accurate Financial Data: Cummins’ historical and forecasted financials integrated for precision.
- Flexible Scenario Analysis: Effortlessly model various forecasts and assumptions.
- Comprehensive Outputs: Automatically computes intrinsic value, NPV, and essential financial metrics.
- User-Friendly Interface: Step-by-step guidance ensures a smooth calculation process.
Who Should Use This Product?
- Investors: Accurately assess Cummins Inc.’s (CMI) fair value prior to making investment choices.
- CFOs: Utilize a professional-grade DCF model for financial reporting and analysis specific to Cummins Inc. (CMI).
- Consultants: Easily customize the template for valuation reports tailored for Cummins Inc. (CMI) clients.
- Entrepreneurs: Gain insights into financial modeling practices employed by leading companies like Cummins Inc. (CMI).
- Educators: Implement it as a teaching resource to illustrate valuation methodologies relevant to Cummins Inc. (CMI).
What the Template Contains
- Pre-Filled Data: Includes Cummins Inc.'s (CMI) historical financials and forecasts.
- Discounted Cash Flow Model: Editable DCF valuation model with automatic calculations.
- Weighted Average Cost of Capital (WACC): A dedicated sheet for calculating WACC based on custom inputs.
- Key Financial Ratios: Analyze Cummins Inc.'s (CMI) profitability, efficiency, and leverage.
- Customizable Inputs: Edit revenue growth, margins, and tax rates with ease.
- Clear Dashboard: Charts and tables summarizing key valuation results.
Disclaimer
All information, articles, and product details provided on this website are for general informational and educational purposes only. We do not claim any ownership over, nor do we intend to infringe upon, any trademarks, copyrights, logos, brand names, or other intellectual property mentioned or depicted on this site. Such intellectual property remains the property of its respective owners, and any references here are made solely for identification or informational purposes, without implying any affiliation, endorsement, or partnership.
We make no representations or warranties, express or implied, regarding the accuracy, completeness, or suitability of any content or products presented. Nothing on this website should be construed as legal, tax, investment, financial, medical, or other professional advice. In addition, no part of this site—including articles or product references—constitutes a solicitation, recommendation, endorsement, advertisement, or offer to buy or sell any securities, franchises, or other financial instruments, particularly in jurisdictions where such activity would be unlawful.
All content is of a general nature and may not address the specific circumstances of any individual or entity. It is not a substitute for professional advice or services. Any actions you take based on the information provided here are strictly at your own risk. You accept full responsibility for any decisions or outcomes arising from your use of this website and agree to release us from any liability in connection with your use of, or reliance upon, the content or products found herein.