
|
DCF-Bewertung des Verbraucherergieunternehmens (CMS-PB) |
Fully Editable: Tailor To Your Needs In Excel Or Sheets
Professional Design: Trusted, Industry-Standard Templates
Investor-Approved Valuation Models
MAC/PC Compatible, Fully Unlocked
No Expertise Is Needed; Easy To Follow
Consumers Energy Company (CMS-PB) Bundle
Verbessern Sie Ihre Investitionsauswahl mit dem DCF-Taschenrechner des Consumers Energy Company (CMS-PB)! Erforschen Sie reale Finanzdaten, passen Sie Wachstumsprognosen und -kosten an und beobachten Sie sofort, wie sich diese Anpassungen auf den inneren Wert des Verbraucherergieunternehmens (CMS-PB) auswirken.
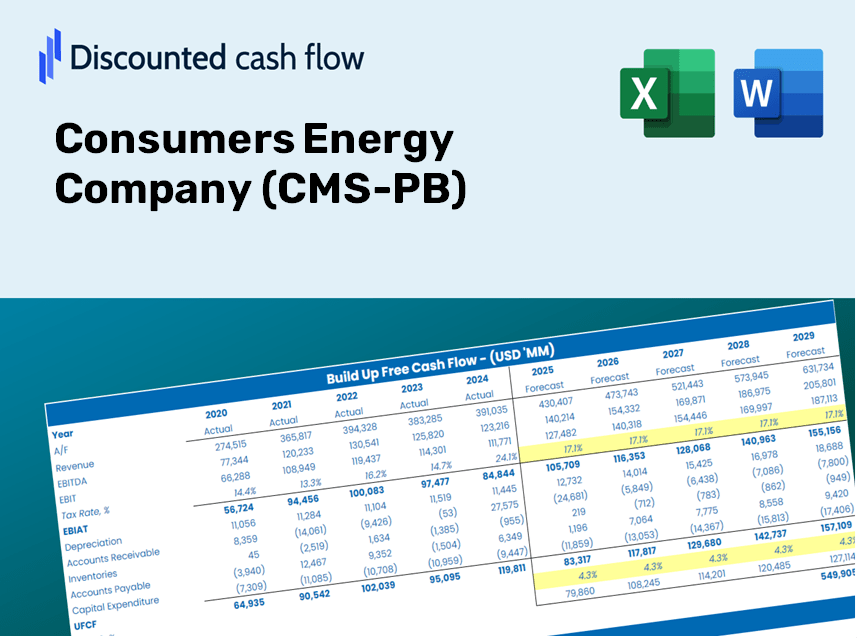
Discounted Cash Flow (DCF) - (USD MM)
| Year | AY1 2020 |
AY2 2021 |
AY3 2022 |
AY4 2023 |
AY5 2024 |
FY1 2025 |
FY2 2026 |
FY3 2027 |
FY4 2028 |
FY5 2029 |
|---|---|---|---|---|---|---|---|---|---|---|
| Revenue | 6,418.0 | 7,329.0 | 8,596.0 | 7,462.0 | 7,515.0 | 7,872.0 | 8,245.9 | 8,637.6 | 9,047.8 | 9,477.6 |
| Revenue Growth, % | 0 | 14.19 | 17.29 | -13.19 | 0.71027 | 4.75 | 4.75 | 4.75 | 4.75 | 4.75 |
| EBITDA | 2,357.0 | 2,437.0 | 2,547.0 | 2,777.0 | 3,071.0 | 2,797.5 | 2,930.4 | 3,069.6 | 3,215.4 | 3,368.1 |
| EBITDA, % | 36.72 | 33.25 | 29.63 | 37.22 | 40.86 | 35.54 | 35.54 | 35.54 | 35.54 | 35.54 |
| Depreciation | 1,043.0 | 1,114.0 | 1,126.0 | 1,180.0 | 1,240.0 | 1,210.1 | 1,267.6 | 1,327.8 | 1,390.9 | 1,457.0 |
| Depreciation, % | 16.25 | 15.2 | 13.1 | 15.81 | 16.5 | 15.37 | 15.37 | 15.37 | 15.37 | 15.37 |
| EBIT | 1,314.0 | 1,323.0 | 1,421.0 | 1,597.0 | 1,831.0 | 1,587.3 | 1,662.7 | 1,741.7 | 1,824.5 | 1,911.1 |
| EBIT, % | 20.47 | 18.05 | 16.53 | 21.4 | 24.36 | 20.16 | 20.16 | 20.16 | 20.16 | 20.16 |
| Total Cash | 32.0 | 452.0 | 164.0 | 227.0 | 103.0 | 204.5 | 214.2 | 224.3 | 235.0 | 246.2 |
| Total Cash, percent | .0 | .0 | .0 | .0 | .0 | .0 | .0 | .0 | .0 | .0 |
| Account Receivables | 872.0 | 943.0 | 1,580.0 | 944.0 | 1,063.0 | 1,127.7 | 1,181.3 | 1,237.4 | 1,296.2 | 1,357.8 |
| Account Receivables, % | 13.59 | 12.87 | 18.38 | 12.65 | 14.15 | 14.33 | 14.33 | 14.33 | 14.33 | 14.33 |
| Inventories | 576.0 | 667.0 | 1,117.0 | 938.0 | 769.0 | 848.2 | 888.5 | 930.7 | 974.9 | 1,021.2 |
| Inventories, % | 8.97 | 9.1 | 12.99 | 12.57 | 10.23 | 10.77 | 10.77 | 10.77 | 10.77 | 10.77 |
| Accounts Payable | 668.0 | 886.0 | 936.0 | 809.0 | 1,093.0 | 925.3 | 969.3 | 1,015.3 | 1,063.5 | 1,114.0 |
| Accounts Payable, % | 10.41 | 12.09 | 10.89 | 10.84 | 14.54 | 11.75 | 11.75 | 11.75 | 11.75 | 11.75 |
| Capital Expenditure | -2,448.0 | -2,209.0 | -2,481.0 | -2,574.0 | -3,178.0 | -2,738.3 | -2,868.4 | -3,004.6 | -3,147.4 | -3,296.9 |
| Capital Expenditure, % | -38.14 | -30.14 | -28.86 | -34.49 | -42.29 | -34.79 | -34.79 | -34.79 | -34.79 | -34.79 |
| Tax Rate, % | 10.69 | 10.69 | 10.69 | 10.69 | 10.69 | 10.69 | 10.69 | 10.69 | 10.69 | 10.69 |
| EBITAT | 1,226.3 | 2,175.0 | 1,318.6 | 1,484.8 | 1,635.3 | 1,487.1 | 1,557.7 | 1,631.7 | 1,709.2 | 1,790.4 |
| Depreciation | ||||||||||
| Changes in Account Receivables | ||||||||||
| Changes in Inventories | ||||||||||
| Changes in Accounts Payable | ||||||||||
| Capital Expenditure | ||||||||||
| UFCF | -958.7 | 1,136.0 | -1,073.4 | 778.8 | 31.3 | -352.7 | -93.0 | -97.4 | -102.0 | -106.9 |
| WACC, % | 4.9 | 5.03 | 4.89 | 4.9 | 4.83 | 4.91 | 4.91 | 4.91 | 4.91 | 4.91 |
| PV UFCF | ||||||||||
| SUM PV UFCF | -673.4 | |||||||||
| Long Term Growth Rate, % | 3.00 | |||||||||
| Free cash flow (T + 1) | -110 | |||||||||
| Terminal Value | -5,767 | |||||||||
| Present Terminal Value | -4,538 | |||||||||
| Enterprise Value | -5,212 | |||||||||
| Net Debt | 16,487 | |||||||||
| Equity Value | -21,699 | |||||||||
| Diluted Shares Outstanding, MM | 298 | |||||||||
| Equity Value Per Share | -72.74 |
What You Will Receive
- Authentic CMS-PB Financials: Access both historical and projected data for precise valuations.
- Customizable Inputs: Adjust WACC, tax rates, revenue growth, and capital expenditures according to your needs.
- Automated Calculations: Intrinsic value and NPV are calculated in real-time.
- Scenario Analysis: Explore various scenarios to assess Consumers Energy Company’s future prospects.
- User-Friendly Design: Crafted for industry professionals while remaining approachable for newcomers.
Key Features
- Comprehensive Historical Data: Access Consumers Energy Company's (CMS-PB) past financial statements and pre-populated forecasts.
- Customizable Parameters: Adjust WACC, tax rates, revenue growth, and EBITDA margins to fit your analysis.
- Real-Time Results: Observe the recalculation of Consumers Energy Company's (CMS-PB) intrinsic value instantly.
- Informative Visualizations: Interactive dashboard charts illustrate valuation outcomes and essential metrics.
- Designed for Precision: A robust tool tailored for analysts, investors, and finance professionals.
How It Functions
- Step 1: Download the Excel spreadsheet.
- Step 2: Examine the pre-filled Consumers Energy Company (CMS-PB) data (both historical and forecasted).
- Step 3: Modify key assumptions (highlighted in yellow) according to your analysis.
- Step 4: Observe automatic recalculations for the intrinsic value of Consumers Energy Company (CMS-PB).
- Step 5: Utilize the results for your investment strategies or reporting needs.
Why Opt for This Calculator?
- User-Friendly Design: Perfectly crafted for both novices and seasoned users.
- Customizable Inputs: Effortlessly adjust parameters to suit your evaluation.
- Real-Time Adjustments: Observe immediate changes to Consumers Energy's valuation as you modify inputs.
- Pre-Configured: Comes with Consumers Energy's actual financial data for swift analysis.
- Relied Upon by Experts: Favored by investors and analysts for making informed decisions.
Who Can Benefit from This Product?
- Professional Investors: Develop comprehensive and trustworthy valuation models for assessing investment opportunities.
- Corporate Finance Teams: Evaluate valuation scenarios to inform and shape corporate strategies.
- Consultants and Advisors: Deliver precise valuation insights tailored for Consumers Energy Company (CMS-PB) clients.
- Students and Educators: Utilize real-world data to enhance financial modeling skills in an educational setting.
- Energy Sector Enthusiasts: Gain insights into how energy companies like Consumers Energy Company (CMS-PB) are valued in the marketplace.
Contents of the Template
- Pre-Filled Data: Features Consumers Energy Company's historical financial data and projections.
- Discounted Cash Flow Model: An editable DCF valuation model equipped with automatic calculations.
- Weighted Average Cost of Capital (WACC): A specific sheet for computing WACC using tailored inputs.
- Key Financial Ratios: Assess Consumers Energy's profitability, efficiency, and financial leverage.
- Customizable Inputs: Easily modify revenue growth, margins, and tax rates.
- Clear Dashboard: Visuals and tables that summarize essential valuation outcomes.
Disclaimer
All information, articles, and product details provided on this website are for general informational and educational purposes only. We do not claim any ownership over, nor do we intend to infringe upon, any trademarks, copyrights, logos, brand names, or other intellectual property mentioned or depicted on this site. Such intellectual property remains the property of its respective owners, and any references here are made solely for identification or informational purposes, without implying any affiliation, endorsement, or partnership.
We make no representations or warranties, express or implied, regarding the accuracy, completeness, or suitability of any content or products presented. Nothing on this website should be construed as legal, tax, investment, financial, medical, or other professional advice. In addition, no part of this site—including articles or product references—constitutes a solicitation, recommendation, endorsement, advertisement, or offer to buy or sell any securities, franchises, or other financial instruments, particularly in jurisdictions where such activity would be unlawful.
All content is of a general nature and may not address the specific circumstances of any individual or entity. It is not a substitute for professional advice or services. Any actions you take based on the information provided here are strictly at your own risk. You accept full responsibility for any decisions or outcomes arising from your use of this website and agree to release us from any liability in connection with your use of, or reliance upon, the content or products found herein.