
|
Kerntechnologien, Inc. (CMT) DCF -Bewertung |
Fully Editable: Tailor To Your Needs In Excel Or Sheets
Professional Design: Trusted, Industry-Standard Templates
Investor-Approved Valuation Models
MAC/PC Compatible, Fully Unlocked
No Expertise Is Needed; Easy To Follow
Core Molding Technologies, Inc. (CMT) Bundle
Optimieren Sie Ihre Analyse und verbessern Sie die Präzision mit unserem DCF -Taschenrechner von CMT (Core Forming Technologies, Inc.)! Mit tatsächlichen Daten aus Kernformtechnologien und anpassbaren Annahmen ermöglichen dieses Tool Sie, CMT wie einen erfahrenen Investor zu prognostizieren, zu bewerten und zu bewerten.
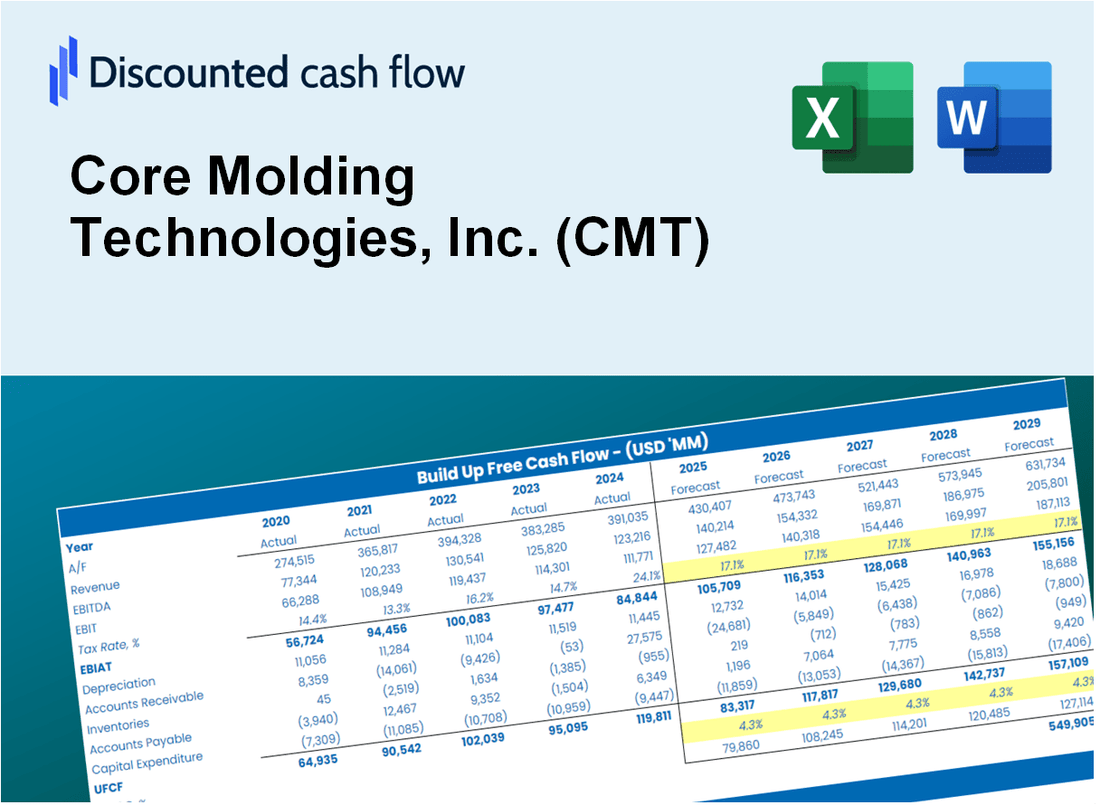
Discounted Cash Flow (DCF) - (USD MM)
| Year | AY1 2020 |
AY2 2021 |
AY3 2022 |
AY4 2023 |
AY5 2024 |
FY1 2025 |
FY2 2026 |
FY3 2027 |
FY4 2028 |
FY5 2029 |
|---|---|---|---|---|---|---|---|---|---|---|
| Revenue | 222.4 | 307.5 | 377.4 | 357.7 | 302.4 | 314.0 | 326.0 | 338.5 | 351.5 | 364.9 |
| Revenue Growth, % | 0 | 38.28 | 22.73 | -5.2 | -15.48 | 3.83 | 3.83 | 3.83 | 3.83 | 3.83 |
| EBITDA | 22.1 | 22.8 | 28.6 | 39.7 | 31.0 | 29.1 | 30.2 | 31.3 | 32.5 | 33.8 |
| EBITDA, % | 9.95 | 7.43 | 7.59 | 11.09 | 10.24 | 9.26 | 9.26 | 9.26 | 9.26 | 9.26 |
| Depreciation | 11.7 | 11.6 | 11.9 | 12.9 | 13.4 | 12.7 | 13.2 | 13.7 | 14.2 | 14.8 |
| Depreciation, % | 5.24 | 3.78 | 3.15 | 3.61 | 4.43 | 4.04 | 4.04 | 4.04 | 4.04 | 4.04 |
| EBIT | 10.5 | 11.2 | 16.7 | 26.8 | 17.6 | 16.4 | 17.0 | 17.7 | 18.3 | 19.0 |
| EBIT, % | 4.71 | 3.65 | 4.44 | 7.48 | 5.81 | 5.22 | 5.22 | 5.22 | 5.22 | 5.22 |
| Total Cash | 4.1 | 6.1 | 4.2 | 24.1 | 41.8 | 16.0 | 16.6 | 17.3 | 17.9 | 18.6 |
| Total Cash, percent | .0 | .0 | .0 | .0 | .0 | .0 | .0 | .0 | .0 | .0 |
| Account Receivables | 27.6 | 37.9 | 46.9 | 48.1 | 36.0 | 39.3 | 40.8 | 42.3 | 43.9 | 45.6 |
| Account Receivables, % | 12.41 | 12.33 | 12.44 | 13.44 | 11.9 | 12.5 | 12.5 | 12.5 | 12.5 | 12.5 |
| Inventories | 18.4 | 25.1 | 23.9 | 22.1 | 18.3 | 22.0 | 22.8 | 23.7 | 24.6 | 25.5 |
| Inventories, % | 8.26 | 8.17 | 6.33 | 6.17 | 6.07 | 7 | 7 | 7 | 7 | 7 |
| Accounts Payable | 17.0 | 22.7 | 29.6 | 24.0 | 17.1 | 22.1 | 23.0 | 23.8 | 24.8 | 25.7 |
| Accounts Payable, % | 7.64 | 7.38 | 7.84 | 6.7 | 5.66 | 7.04 | 7.04 | 7.04 | 7.04 | 7.04 |
| Capital Expenditure | -3.7 | -11.6 | -16.6 | -9.1 | -11.5 | -10.2 | -10.5 | -10.9 | -11.4 | -11.8 |
| Capital Expenditure, % | -1.66 | -3.76 | -4.4 | -2.54 | -3.81 | -3.23 | -3.23 | -3.23 | -3.23 | -3.23 |
| Tax Rate, % | 23.92 | 23.92 | 23.92 | 23.92 | 23.92 | 23.92 | 23.92 | 23.92 | 23.92 | 23.92 |
| EBITAT | 18.8 | 5.9 | 14.0 | 21.1 | 13.4 | 12.8 | 13.3 | 13.8 | 14.3 | 14.9 |
| Depreciation | ||||||||||
| Changes in Account Receivables | ||||||||||
| Changes in Inventories | ||||||||||
| Changes in Accounts Payable | ||||||||||
| Capital Expenditure | ||||||||||
| UFCF | -2.2 | -5.5 | 8.4 | 20.0 | 24.2 | 13.4 | 14.4 | 15.0 | 15.6 | 16.2 |
| WACC, % | 5.89 | 5.66 | 5.81 | 5.79 | 5.77 | 5.78 | 5.78 | 5.78 | 5.78 | 5.78 |
| PV UFCF | ||||||||||
| SUM PV UFCF | 62.9 | |||||||||
| Long Term Growth Rate, % | 3.00 | |||||||||
| Free cash flow (T + 1) | 17 | |||||||||
| Terminal Value | 598 | |||||||||
| Present Terminal Value | 452 | |||||||||
| Enterprise Value | 515 | |||||||||
| Net Debt | -18 | |||||||||
| Equity Value | 533 | |||||||||
| Diluted Shares Outstanding, MM | 9 | |||||||||
| Equity Value Per Share | 60.62 |
What You Will Get
- Real CMT Financials: Access to historical and projected data for precise valuation.
- Customizable Inputs: Adjust WACC, tax rates, revenue growth, and capital expenditures as needed.
- Dynamic Calculations: Intrinsic value and NPV are computed in real-time.
- Scenario Analysis: Evaluate multiple scenarios to assess Core Molding Technologies’ future performance.
- User-Friendly Design: Crafted for professionals while remaining easy to navigate for newcomers.
Key Features
- Comprehensive DCF Calculator: Features detailed unlevered and levered DCF valuation models tailored for Core Molding Technologies, Inc. (CMT).
- WACC Calculator: Pre-configured Weighted Average Cost of Capital sheet with adjustable inputs for accurate assessments.
- Customizable Forecast Assumptions: Easily alter growth projections, capital expenditures, and discount rates to fit your analysis.
- Integrated Financial Ratios: Evaluate profitability, leverage, and efficiency ratios specifically for Core Molding Technologies, Inc. (CMT).
- Interactive Dashboard and Charts: Visual representations summarize essential valuation metrics for straightforward analysis.
How It Works
- 1. Access the Template: Download and open the Excel file featuring Core Molding Technologies, Inc.'s (CMT) detailed data.
- 2. Update Assumptions: Modify essential inputs such as growth projections, WACC, and capital investments.
- 3. Analyze Results Immediately: The DCF model automatically computes intrinsic value and NPV in real-time.
- 4. Explore Scenarios: Evaluate various forecasts to assess different valuation possibilities.
- 5. Present with Assurance: Deliver professional valuation insights to bolster your decision-making process.
Why Choose This Calculator for Core Molding Technologies, Inc. (CMT)?
- Accuracy: Utilizes real CMT financial data to ensure precise calculations.
- Flexibility: Allows users to easily adjust and explore various input scenarios.
- Time-Saving: Eliminates the need to create a DCF model from the ground up.
- Professional-Grade: Crafted with the expertise and detail expected at the CFO level.
- User-Friendly: Intuitive interface designed for users of all financial backgrounds.
Who Should Use This Product?
- Manufacturing Students: Understand production processes and apply them using real-world examples from Core Molding Technologies, Inc. (CMT).
- Researchers: Utilize industry-specific models in your studies focused on composite manufacturing.
- Investors: Evaluate your investment strategies and assess the performance metrics for Core Molding Technologies, Inc. (CMT).
- Market Analysts: Enhance your analysis with a ready-to-use, customizable financial model tailored for the manufacturing sector.
- Entrepreneurs: Discover how large manufacturing firms like Core Molding Technologies, Inc. (CMT) operate and are evaluated.
What the Template Contains
- Comprehensive DCF Model: Editable template featuring detailed valuation calculations for Core Molding Technologies, Inc. (CMT).
- Real-World Data: CMT’s historical and projected financials preloaded for thorough analysis.
- Customizable Parameters: Modify WACC, growth rates, and tax assumptions to explore various scenarios.
- Financial Statements: Complete annual and quarterly breakdowns for enhanced insights into CMT’s performance.
- Key Ratios: Integrated analysis for profitability, efficiency, and leverage specific to CMT.
- Dashboard with Visual Outputs: Charts and tables providing clear, actionable results for informed decision-making.
Disclaimer
All information, articles, and product details provided on this website are for general informational and educational purposes only. We do not claim any ownership over, nor do we intend to infringe upon, any trademarks, copyrights, logos, brand names, or other intellectual property mentioned or depicted on this site. Such intellectual property remains the property of its respective owners, and any references here are made solely for identification or informational purposes, without implying any affiliation, endorsement, or partnership.
We make no representations or warranties, express or implied, regarding the accuracy, completeness, or suitability of any content or products presented. Nothing on this website should be construed as legal, tax, investment, financial, medical, or other professional advice. In addition, no part of this site—including articles or product references—constitutes a solicitation, recommendation, endorsement, advertisement, or offer to buy or sell any securities, franchises, or other financial instruments, particularly in jurisdictions where such activity would be unlawful.
All content is of a general nature and may not address the specific circumstances of any individual or entity. It is not a substitute for professional advice or services. Any actions you take based on the information provided here are strictly at your own risk. You accept full responsibility for any decisions or outcomes arising from your use of this website and agree to release us from any liability in connection with your use of, or reliance upon, the content or products found herein.