
|
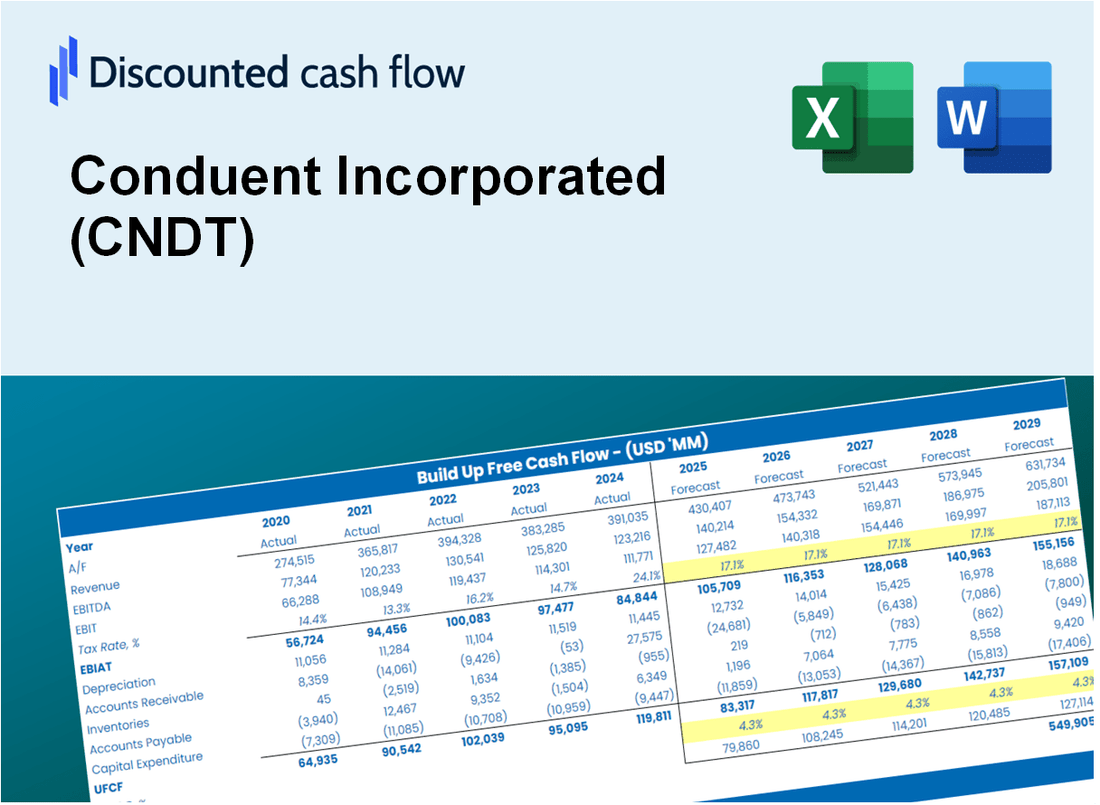
DCF -Bewertung von Conaduent Incorporated (CNDT) |
Fully Editable: Tailor To Your Needs In Excel Or Sheets
Professional Design: Trusted, Industry-Standard Templates
Investor-Approved Valuation Models
MAC/PC Compatible, Fully Unlocked
No Expertise Is Needed; Easy To Follow
Conduent Incorporated (CNDT) Bundle
Gewinnen Sie mit unserem ausgefeilten DCF -Taschenrechner eine Beherrschung über Ihre Bewertungsanalyse (CNDT) in Conduct Incorporated! Diese Excel -Vorlage, die mit realen (CNDT-) Daten vorinstalliert ist, ermöglicht es Ihnen, die Prognosen und Annahmen anzupassen, um den inneren Wert von Konsumenten genau zu bestimmen.
What You Will Get
- Real Conduent Data: Preloaded financials – from revenue to EBIT – based on actual and projected figures.
- Full Customization: Adjust all critical parameters (yellow cells) like WACC, growth %, and tax rates.
- Instant Valuation Updates: Automatic recalculations to analyze the impact of changes on Conduent’s fair value.
- Versatile Excel Template: Tailored for quick edits, scenario testing, and detailed projections.
- Time-Saving and Accurate: Skip building models from scratch while maintaining precision and flexibility.
Key Features
- 🔍 Real-Life CNDT Financials: Pre-filled historical and projected data for Conduent Incorporated (CNDT).
- ✏️ Fully Customizable Inputs: Adjust all critical parameters (yellow cells) like WACC, growth %, and tax rates.
- 📊 Professional DCF Valuation: Built-in formulas calculate Conduent’s intrinsic value using the Discounted Cash Flow method.
- ⚡ Instant Results: Visualize Conduent’s valuation instantly after making changes.
- Scenario Analysis: Test and compare outcomes for various financial assumptions side-by-side.
How It Works
- Download: Get the ready-to-use Excel file featuring Conduent Incorporated's (CNDT) financial data.
- Customize: Modify forecasts, including revenue growth, EBITDA %, and WACC.
- Update Automatically: The intrinsic value and NPV calculations refresh in real-time.
- Test Scenarios: Generate multiple projections and instantly compare results.
- Make Decisions: Leverage the valuation outcomes to inform your investment strategy.
Why Choose Conduent Incorporated (CNDT)?
- Streamlined Processes: Benefit from efficient solutions that save you valuable time.
- Enhanced Accuracy: Access reliable data and methodologies that minimize errors in your operations.
- Completely Customizable: Adjust services to align with your specific business needs and goals.
- User-Friendly Interface: Intuitive designs and clear outputs make it easy to navigate and understand results.
- Preferred by Professionals: Valued by industry leaders for its commitment to quality and effectiveness.
Who Should Use This Product?
- Finance Students: Explore valuation methodologies and practice with real data related to Conduent Incorporated (CNDT).
- Academics: Utilize industry-standard models for your teaching or research involving Conduent Incorporated (CNDT).
- Investors: Validate your investment hypotheses and evaluate valuation results for Conduent Incorporated (CNDT).
- Analysts: Enhance your efficiency with a ready-to-use, customizable DCF model tailored for Conduent Incorporated (CNDT).
- Small Business Owners: Discover how large public firms like Conduent Incorporated (CNDT) are assessed and valued.
What the Template Contains
- Preloaded CNDT Data: Historical and projected financial data, including revenue, EBIT, and capital expenditures.
- DCF and WACC Models: Professional-grade sheets for calculating intrinsic value and Weighted Average Cost of Capital.
- Editable Inputs: Yellow-highlighted cells for adjusting revenue growth, tax rates, and discount rates.
- Financial Statements: Comprehensive annual and quarterly financials for deeper analysis.
- Key Ratios: Profitability, leverage, and efficiency ratios to evaluate performance.
- Dashboard and Charts: Visual summaries of valuation outcomes and assumptions.
Disclaimer
All information, articles, and product details provided on this website are for general informational and educational purposes only. We do not claim any ownership over, nor do we intend to infringe upon, any trademarks, copyrights, logos, brand names, or other intellectual property mentioned or depicted on this site. Such intellectual property remains the property of its respective owners, and any references here are made solely for identification or informational purposes, without implying any affiliation, endorsement, or partnership.
We make no representations or warranties, express or implied, regarding the accuracy, completeness, or suitability of any content or products presented. Nothing on this website should be construed as legal, tax, investment, financial, medical, or other professional advice. In addition, no part of this site—including articles or product references—constitutes a solicitation, recommendation, endorsement, advertisement, or offer to buy or sell any securities, franchises, or other financial instruments, particularly in jurisdictions where such activity would be unlawful.
All content is of a general nature and may not address the specific circumstances of any individual or entity. It is not a substitute for professional advice or services. Any actions you take based on the information provided here are strictly at your own risk. You accept full responsibility for any decisions or outcomes arising from your use of this website and agree to release us from any liability in connection with your use of, or reliance upon, the content or products found herein.