
|
DCF -Bewertung der Conmed Corporation (CNMD) |
Fully Editable: Tailor To Your Needs In Excel Or Sheets
Professional Design: Trusted, Industry-Standard Templates
Investor-Approved Valuation Models
MAC/PC Compatible, Fully Unlocked
No Expertise Is Needed; Easy To Follow
CONMED Corporation (CNMD) Bundle
Vereinfachen Sie die Bewertung der Conmed Corporation (CNMD) mit diesem anpassbaren DCF -Taschenrechner! Mit Real Conmed Corporation (CNMD) -Ver Finanzdaten und einstellbaren Prognoseeingaben können Sie Szenarien testen und Conmed Corporation (CNMD) in wenigen Minuten aufdecken.
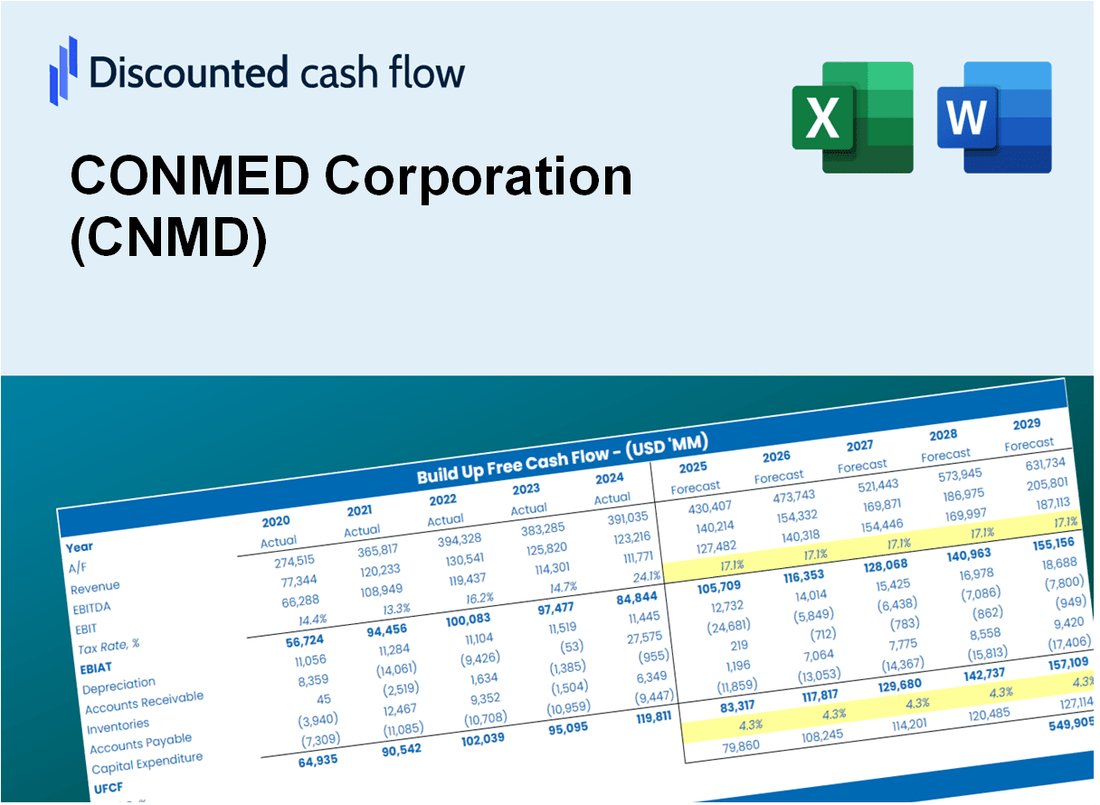
Discounted Cash Flow (DCF) - (USD MM)
| Year | AY1 2020 |
AY2 2021 |
AY3 2022 |
AY4 2023 |
AY5 2024 |
FY1 2025 |
FY2 2026 |
FY3 2027 |
FY4 2028 |
FY5 2029 |
|---|---|---|---|---|---|---|---|---|---|---|
| Revenue | 862.5 | 1,010.6 | 1,045.5 | 1,244.7 | 1,307.0 | 1,453.0 | 1,615.4 | 1,795.9 | 1,996.5 | 2,219.6 |
| Revenue Growth, % | 0 | 17.18 | 3.45 | 19.06 | 5 | 11.17 | 11.17 | 11.17 | 11.17 | 11.17 |
| EBITDA | 113.6 | 158.4 | 7.8 | 192.5 | 272.2 | 191.4 | 212.8 | 236.6 | 263.0 | 292.4 |
| EBITDA, % | 13.17 | 15.67 | 0.74588 | 15.46 | 20.82 | 13.17 | 13.17 | 13.17 | 13.17 | 13.17 |
| Depreciation | 52.2 | 49.8 | 49.8 | 51.4 | 51.3 | 69.2 | 76.9 | 85.5 | 95.0 | 105.6 |
| Depreciation, % | 6.06 | 4.93 | 4.76 | 4.13 | 3.93 | 4.76 | 4.76 | 4.76 | 4.76 | 4.76 |
| EBIT | 61.3 | 108.6 | -42.0 | 141.1 | 220.9 | 122.3 | 135.9 | 151.1 | 168.0 | 186.8 |
| EBIT, % | 7.11 | 10.74 | -4.01 | 11.33 | 16.9 | 8.42 | 8.42 | 8.42 | 8.42 | 8.42 |
| Total Cash | 27.4 | 20.8 | 28.9 | 24.3 | 24.5 | 34.4 | 38.2 | 42.5 | 47.2 | 52.5 |
| Total Cash, percent | .0 | .0 | .0 | .0 | .0 | .0 | .0 | .0 | .0 | .0 |
| Account Receivables | 177.2 | 183.9 | 191.3 | 242.3 | 237.7 | 275.2 | 305.9 | 340.1 | 378.1 | 420.3 |
| Account Receivables, % | 20.54 | 18.19 | 18.3 | 19.46 | 18.19 | 18.94 | 18.94 | 18.94 | 18.94 | 18.94 |
| Inventories | 194.9 | 231.6 | 332.3 | 318.3 | 346.7 | 376.1 | 418.1 | 464.8 | 516.7 | 574.4 |
| Inventories, % | 22.59 | 22.92 | 31.79 | 25.57 | 26.53 | 25.88 | 25.88 | 25.88 | 25.88 | 25.88 |
| Accounts Payable | 53.3 | 58.2 | 73.4 | 88.2 | 102.2 | 98.4 | 109.4 | 121.7 | 135.2 | 150.4 |
| Accounts Payable, % | 6.18 | 5.76 | 7.02 | 7.09 | 7.82 | 6.77 | 6.77 | 6.77 | 6.77 | 6.77 |
| Capital Expenditure | -13.0 | -14.9 | -21.8 | -19.0 | -13.1 | -22.1 | -24.5 | -27.3 | -30.3 | -33.7 |
| Capital Expenditure, % | -1.51 | -1.47 | -2.08 | -1.53 | -1 | -1.52 | -1.52 | -1.52 | -1.52 | -1.52 |
| Tax Rate, % | 18.77 | 18.77 | 18.77 | 18.77 | 18.77 | 18.77 | 18.77 | 18.77 | 18.77 | 18.77 |
| EBITAT | 364.2 | 92.9 | -47.7 | 112.5 | 179.4 | 109.2 | 121.4 | 135.0 | 150.0 | 166.8 |
| Depreciation | ||||||||||
| Changes in Account Receivables | ||||||||||
| Changes in Inventories | ||||||||||
| Changes in Accounts Payable | ||||||||||
| Capital Expenditure | ||||||||||
| UFCF | 84.7 | 89.2 | -112.7 | 122.8 | 207.8 | 85.7 | 112.0 | 124.5 | 138.4 | 153.9 |
| WACC, % | 7.12 | 6.89 | 7.12 | 6.79 | 6.82 | 6.95 | 6.95 | 6.95 | 6.95 | 6.95 |
| PV UFCF | ||||||||||
| SUM PV UFCF | 495.6 | |||||||||
| Long Term Growth Rate, % | 2.00 | |||||||||
| Free cash flow (T + 1) | 157 | |||||||||
| Terminal Value | 3,171 | |||||||||
| Present Terminal Value | 2,266 | |||||||||
| Enterprise Value | 2,762 | |||||||||
| Net Debt | 881 | |||||||||
| Equity Value | 1,881 | |||||||||
| Diluted Shares Outstanding, MM | 31 | |||||||||
| Equity Value Per Share | 60.45 |
What You Will Get
- Real CONMED Data: Preloaded financials – from revenue to EBIT – based on actual and projected figures for CONMED Corporation (CNMD).
- Full Customization: Adjust all critical parameters (yellow cells) like WACC, growth %, and tax rates to fit your analysis.
- Instant Valuation Updates: Automatic recalculations to analyze the impact of changes on CONMED's fair value.
- Versatile Excel Template: Tailored for quick edits, scenario testing, and detailed projections specific to CONMED Corporation (CNMD).
- Time-Saving and Accurate: Skip building models from scratch while ensuring precision and flexibility in your assessments.
Key Features
- Customizable Financial Inputs: Adjust essential metrics such as revenue growth, EBITDA %, and capital expenditures for CONMED Corporation (CNMD).
- Instant DCF Valuation: Automatically computes intrinsic value, NPV, and other key financial metrics.
- High-Precision Accuracy: Utilizes CONMED's actual financial data to ensure realistic valuation results.
- Seamless Scenario Analysis: Easily evaluate various assumptions and compare different outcomes.
- Efficiency Booster: Avoid the complexities of building valuation models from the ground up.
How It Works
- Download: Obtain the pre-formatted Excel file containing CONMED Corporation's (CNMD) financial data.
- Customize: Modify projections such as revenue growth, EBITDA %, and WACC to fit your analysis.
- Update Automatically: Watch as intrinsic value and NPV calculations refresh in real-time.
- Test Scenarios: Develop various forecasts and instantly compare the results.
- Make Decisions: Leverage the valuation findings to inform your investment choices.
Why Choose This Calculator for CONMED Corporation (CNMD)?
- Accuracy: Up-to-date CONMED financials guarantee precise data.
- Flexibility: Tailored for users to easily adjust and experiment with inputs.
- Time-Saving: Avoid the complexity of creating a DCF model from the ground up.
- Professional-Grade: Crafted with CFO-level detail and functionality in mind.
- User-Friendly: Intuitive interface, suitable for users without extensive financial modeling skills.
Who Should Use This Product?
- Healthcare Students: Understand the financial aspects of medical technology companies and apply valuation methods using real data.
- Researchers: Integrate advanced financial models into studies related to the healthcare sector.
- Investors: Validate your investment strategies and evaluate the financial performance of CONMED Corporation (CNMD).
- Financial Analysts: Enhance your analysis with a customizable DCF model tailored for healthcare companies.
- Medical Device Entrepreneurs: Learn from the valuation practices of established firms like CONMED Corporation (CNMD).
What the Template Contains
- Pre-Filled DCF Model: CONMED Corporation’s (CNMD) financial data preloaded for immediate use.
- WACC Calculator: Detailed calculations for Weighted Average Cost of Capital.
- Financial Ratios: Evaluate CONMED Corporation’s (CNMD) profitability, leverage, and efficiency.
- Editable Inputs: Change assumptions such as growth, margins, and CAPEX to fit your scenarios.
- Financial Statements: Annual and quarterly reports to support detailed analysis.
- Interactive Dashboard: Easily visualize key valuation metrics and results.
Disclaimer
All information, articles, and product details provided on this website are for general informational and educational purposes only. We do not claim any ownership over, nor do we intend to infringe upon, any trademarks, copyrights, logos, brand names, or other intellectual property mentioned or depicted on this site. Such intellectual property remains the property of its respective owners, and any references here are made solely for identification or informational purposes, without implying any affiliation, endorsement, or partnership.
We make no representations or warranties, express or implied, regarding the accuracy, completeness, or suitability of any content or products presented. Nothing on this website should be construed as legal, tax, investment, financial, medical, or other professional advice. In addition, no part of this site—including articles or product references—constitutes a solicitation, recommendation, endorsement, advertisement, or offer to buy or sell any securities, franchises, or other financial instruments, particularly in jurisdictions where such activity would be unlawful.
All content is of a general nature and may not address the specific circumstances of any individual or entity. It is not a substitute for professional advice or services. Any actions you take based on the information provided here are strictly at your own risk. You accept full responsibility for any decisions or outcomes arising from your use of this website and agree to release us from any liability in connection with your use of, or reliance upon, the content or products found herein.