
|
Coal India Limited (Coalindia.NS) DCF -Bewertung |
Fully Editable: Tailor To Your Needs In Excel Or Sheets
Professional Design: Trusted, Industry-Standard Templates
Investor-Approved Valuation Models
MAC/PC Compatible, Fully Unlocked
No Expertise Is Needed; Easy To Follow
Coal India Limited (COALINDIA.NS) Bundle
Maximieren Sie die Effizienz und verbessern Sie die Präzision mit unseren (Kohle-) DCF -Rechner! Mit realen Daten von Coal India Limited und anpassbaren Annahmen ermöglichen dieses Tool Sie, wie ein Experteninvestor prognostizieren, analysieren und value (Coalindianer).
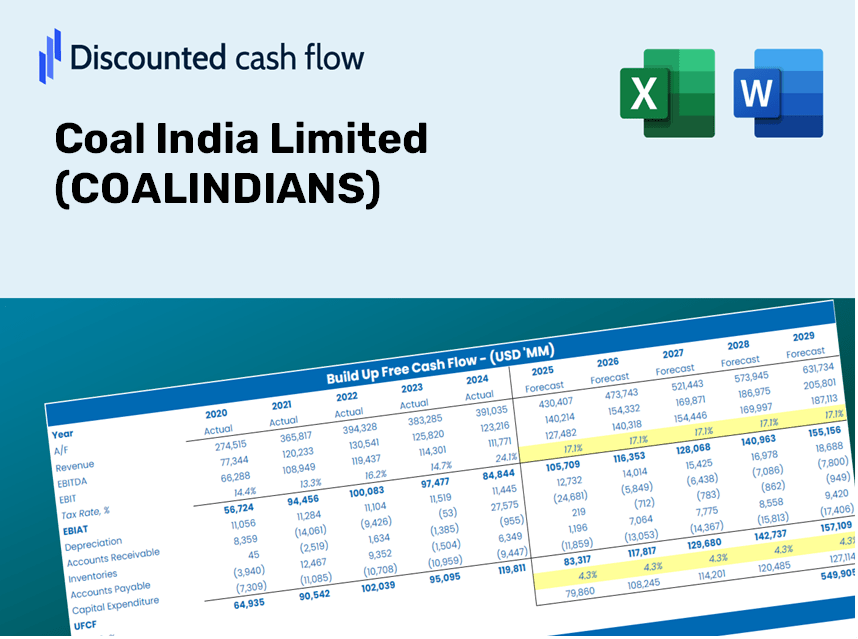
Discounted Cash Flow (DCF) - (USD MM)
| Year | AY1 2021 |
AY2 2022 |
AY3 2023 |
AY4 2024 |
AY5 2025 |
FY1 2026 |
FY2 2027 |
FY3 2028 |
FY4 2029 |
FY5 2030 |
|---|---|---|---|---|---|---|---|---|---|---|
| Revenue | 857,817.4 | 1,097,154.2 | 1,321,099.6 | 1,352,714.9 | 1,327,955.3 | 1,490,214.5 | 1,672,299.6 | 1,876,633.3 | 2,105,933.9 | 2,363,252.1 |
| Revenue Growth, % | 0 | 27.9 | 20.41 | 2.39 | -1.83 | 12.22 | 12.22 | 12.22 | 12.22 | 12.22 |
| EBITDA | 186,359.8 | 247,472.5 | 441,655.8 | 478,966.0 | 469,941.9 | 442,616.9 | 496,699.1 | 557,389.4 | 625,495.2 | 701,922.7 |
| EBITDA, % | 21.72 | 22.56 | 33.43 | 35.41 | 35.39 | 29.7 | 29.7 | 29.7 | 29.7 | 29.7 |
| Depreciation | 36,408.1 | 42,842.0 | 66,601.5 | 65,323.5 | 90,140.8 | 73,936.9 | 82,971.1 | 93,109.1 | 104,485.8 | 117,252.6 |
| Depreciation, % | 4.24 | 3.9 | 5.04 | 4.83 | 6.79 | 4.96 | 4.96 | 4.96 | 4.96 | 4.96 |
| EBIT | 149,951.7 | 204,630.5 | 375,054.3 | 413,642.5 | 379,801.1 | 368,680.0 | 413,728.0 | 464,280.3 | 521,009.4 | 584,670.1 |
| EBIT, % | 17.48 | 18.65 | 28.39 | 30.58 | 28.6 | 24.74 | 24.74 | 24.74 | 24.74 | 24.74 |
| Total Cash | 202,600.6 | 390,797.7 | 431,114.4 | 329,338.9 | 363,709.5 | 428,006.2 | 480,303.1 | 538,989.9 | 604,847.6 | 678,752.3 |
| Total Cash, percent | .0 | .0 | .0 | .0 | .0 | .0 | .0 | .0 | .0 | .0 |
| Account Receivables | 370,581.1 | 113,676.8 | 130,604.8 | 132,557.5 | 127,466.2 | 246,915.5 | 277,085.5 | 310,941.8 | 348,934.9 | 391,570.3 |
| Account Receivables, % | 43.2 | 10.36 | 9.89 | 9.8 | 9.6 | 16.57 | 16.57 | 16.57 | 16.57 | 16.57 |
| Inventories | 89,474.7 | 70,756.8 | 81,546.8 | 101,772.3 | 126,137.0 | 119,439.0 | 134,032.9 | 150,410.0 | 168,788.2 | 189,411.9 |
| Inventories, % | 10.43 | 6.45 | 6.17 | 7.52 | 9.5 | 8.01 | 8.01 | 8.01 | 8.01 | 8.01 |
| Accounts Payable | 84,731.4 | 86,035.3 | 85,491.8 | 83,856.5 | 102,056.3 | 113,479.4 | 127,345.1 | 142,905.0 | 160,366.2 | 179,960.9 |
| Accounts Payable, % | 9.88 | 7.84 | 6.47 | 6.2 | 7.69 | 7.61 | 7.61 | 7.61 | 7.61 | 7.61 |
| Capital Expenditure | -110,152.0 | -120,231.9 | -153,135.6 | -168,213.4 | -132,929.7 | -172,377.2 | -193,439.4 | -217,075.3 | -243,599.1 | -273,363.8 |
| Capital Expenditure, % | -12.84 | -10.96 | -11.59 | -12.44 | -10.01 | -11.57 | -11.57 | -11.57 | -11.57 | -11.57 |
| Tax Rate, % | 24.72 | 24.72 | 24.72 | 24.72 | 24.72 | 24.72 | 24.72 | 24.72 | 24.72 | 24.72 |
| EBITAT | 105,744.1 | 150,404.6 | 275,287.0 | 316,950.4 | 285,930.5 | 272,327.0 | 305,601.9 | 342,942.6 | 384,845.8 | 431,869.0 |
| Depreciation | ||||||||||
| Changes in Account Receivables | ||||||||||
| Changes in Inventories | ||||||||||
| Changes in Accounts Payable | ||||||||||
| Capital Expenditure | ||||||||||
| UFCF | -343,324.2 | 349,940.8 | 160,491.4 | 190,247.0 | 242,068.0 | 72,558.5 | 164,235.4 | 184,302.9 | 206,822.4 | 232,093.4 |
| WACC, % | 4.62 | 4.63 | 4.63 | 4.64 | 4.63 | 4.63 | 4.63 | 4.63 | 4.63 | 4.63 |
| PV UFCF | ||||||||||
| SUM PV UFCF | 737,941.8 | |||||||||
| Long Term Growth Rate, % | 2.00 | |||||||||
| Free cash flow (T + 1) | 236,735 | |||||||||
| Terminal Value | 9,002,384 | |||||||||
| Present Terminal Value | 7,179,311 | |||||||||
| Enterprise Value | 7,917,253 | |||||||||
| Net Debt | -20,150 | |||||||||
| Equity Value | 7,937,402 | |||||||||
| Diluted Shares Outstanding, MM | 6,163 | |||||||||
| Equity Value Per Share | 1,287.97 |
Benefits You Will Enjoy
- Adjustable Forecast Inputs: Effortlessly modify assumptions (growth %, margins, WACC) to develop various scenarios.
- Real-World Data: Coal India Limited's financial information pre-loaded to enhance your analysis.
- Automated DCF Outputs: The template provides calculations for Net Present Value (NPV) and intrinsic value automatically.
- Customizable and Professional: A refined Excel model tailored to fit your valuation requirements.
- Designed for Analysts and Investors: Perfect for testing forecasts, validating strategies, and saving valuable time.
Key Features
- Pre-Loaded Data: Coal India Limited’s historical financial statements and pre-filled forecasts.
- Fully Adjustable Inputs: Customize WACC, tax rates, revenue growth, and EBITDA margins.
- Instant Results: View Coal India Limited’s intrinsic value recalculating in real time.
- Clear Visual Outputs: Dashboard charts showcase valuation results and essential metrics.
- Built for Accuracy: A professional tool designed for analysts, investors, and finance professionals.
How It Works
- Step 1: Download the ready-to-use Excel template featuring Coal India Limited (COALINDIANS) data.
- Step 2: Examine the filled sheets to familiarize yourself with the key performance indicators.
- Step 3: Adjust forecasts and assumptions in the editable yellow cells (WACC, growth rates, profit margins).
- Step 4: Instantly see the updated results, including the intrinsic value of Coal India Limited (COALINDIANS).
- Step 5: Utilize the outputs to make well-informed investment decisions or create detailed reports.
Why Choose Coal India Limited (COALINDIANS)?
- Time-Saving: Access an established framework without the hassle of building a model from the ground up.
- Enhanced Accuracy: Dependable financial insights and formulas minimize valuation errors.
- Completely Customizable: Adjust the framework to align with your specific assumptions and forecasts.
- User-Friendly: Intuitive charts and outputs simplify the analysis of results.
- Endorsed by Professionals: Crafted for experts who prioritize accuracy and ease of use.
Who Should Utilize This Product?
- Investors: Assess Coal India Limited’s valuation prior to making stock transactions.
- CFOs and Financial Analysts: Optimize valuation workflows and evaluate financial forecasts.
- Startup Founders: Discover how established public enterprises like Coal India Limited are valued.
- Consultants: Create comprehensive valuation reports for clients based on market data.
- Students and Educators: Employ practical data to learn and instruct valuation methods.
What the Template Contains
- Pre-Filled DCF Model: Coal India Limited’s financial data preloaded for immediate use.
- WACC Calculator: Comprehensive calculations for the Weighted Average Cost of Capital.
- Financial Ratios: Assess the profitability, leverage, and efficiency of Coal India Limited (COALINDIANS).
- Editable Inputs: Adjust assumptions such as growth, margins, and CAPEX to align with your scenarios.
- Financial Statements: Access annual and quarterly reports for in-depth analysis.
- Interactive Dashboard: Effortlessly visualize essential valuation metrics and results.
Disclaimer
All information, articles, and product details provided on this website are for general informational and educational purposes only. We do not claim any ownership over, nor do we intend to infringe upon, any trademarks, copyrights, logos, brand names, or other intellectual property mentioned or depicted on this site. Such intellectual property remains the property of its respective owners, and any references here are made solely for identification or informational purposes, without implying any affiliation, endorsement, or partnership.
We make no representations or warranties, express or implied, regarding the accuracy, completeness, or suitability of any content or products presented. Nothing on this website should be construed as legal, tax, investment, financial, medical, or other professional advice. In addition, no part of this site—including articles or product references—constitutes a solicitation, recommendation, endorsement, advertisement, or offer to buy or sell any securities, franchises, or other financial instruments, particularly in jurisdictions where such activity would be unlawful.
All content is of a general nature and may not address the specific circumstances of any individual or entity. It is not a substitute for professional advice or services. Any actions you take based on the information provided here are strictly at your own risk. You accept full responsibility for any decisions or outcomes arising from your use of this website and agree to release us from any liability in connection with your use of, or reliance upon, the content or products found herein.