
|
Cofinimmo SA (COFB.BR) DCF -Bewertung |
Fully Editable: Tailor To Your Needs In Excel Or Sheets
Professional Design: Trusted, Industry-Standard Templates
Investor-Approved Valuation Models
MAC/PC Compatible, Fully Unlocked
No Expertise Is Needed; Easy To Follow
Cofinimmo SA (COFB.BR) Bundle
Bewerten Sie die finanziellen Aussichten von Cofinimmo SA wie ein Experte! Dieser (COFBBR) DCF-Taschenrechner bietet vorgefüllte Finanzdaten sowie die Flexibilität, das Umsatzwachstum, WACC, Margen und andere wichtige Annahmen zu ändern, um sich an Ihren Projektionen anzupassen.
What You Will Receive
- Authentic Cofinimmo Data: Comprehensive financials preloaded – covering everything from revenue to EBIT – based on historical and forecasted information.
- Complete Customization: Modify all essential parameters (yellow cells) such as WACC, growth %, and tax rates.
- Immediate Valuation Adjustments: Automatic recalculations to evaluate the effects of changes on Cofinimmo’s fair value.
- Flexible Excel Template: Designed for quick modifications, scenario analysis, and in-depth projections.
- Efficient and Precise: Avoid the hassle of building models from the ground up while ensuring accuracy and adaptability.
Key Features
- Actual Financial Data for Cofinimmo SA: Gain access to reliable historical records and future forecasts.
- Adjustable Forecast Parameters: Modify the yellow-highlighted fields, including WACC, growth rates, and profit margins.
- Real-Time Calculations: Automatic updates for DCF, Net Present Value (NPV), and cash flow evaluations.
- Intuitive Visual Dashboard: User-friendly charts and summaries to help illustrate your valuation findings.
- Designed for All Skill Levels: A straightforward and intuitive layout tailored for investors, CFOs, and consultants.
How It Works
- Step 1: Download the Excel spreadsheet.
- Step 2: Examine the pre-filled financial data and projections for Cofinimmo SA (COFBBR).
- Step 3: Adjust key inputs such as revenue growth, WACC, and tax rates (highlighted cells).
- Step 4: Observe the DCF model refresh in real-time as you modify your assumptions.
- Step 5: Evaluate the results and utilize the insights for your investment strategies.
Why Choose Cofinimmo SA (COFBBR) Calculator?
- Accuracy: Utilizes real Cofinimmo SA financials for precise data.
- Flexibility: Built for users to easily test and adjust inputs as needed.
- Time-Saving: Avoid the complexities of creating a DCF model from the ground up.
- Professional-Grade: Crafted with the expertise and usability expected by CFOs.
- User-Friendly: Intuitive design, suitable for users with varying levels of financial modeling expertise.
Who Can Benefit from This Product?
- Real Estate Students: Understand valuation methodologies and apply them to real-world data.
- Researchers: Utilize industry-specific models for academic studies or projects.
- Investors: Validate your hypotheses and evaluate valuation results for Cofinimmo SA (COFBBR) stock.
- Market Analysts: Enhance your efficiency with a customizable DCF model tailored for property analysis.
- Property Developers: Discover how institutional investors assess large real estate companies like Cofinimmo SA (COFBBR).
Contents of the Template
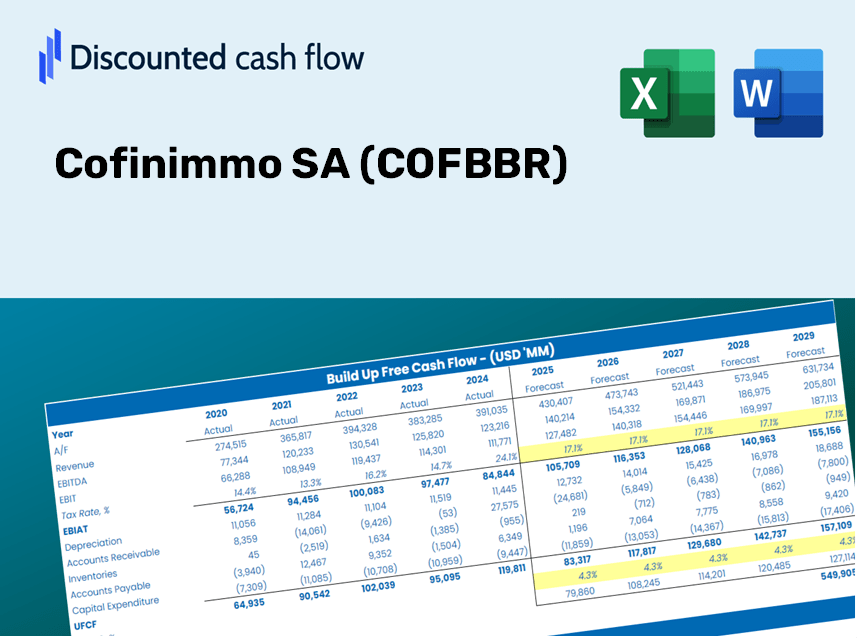
- Operating and Balance Sheet Data: Pre-filled historical data and forecasts for Cofinimmo SA (COFBBR), including revenue, EBITDA, EBIT, and capital expenditures.
- WACC Calculation: A specific sheet dedicated to the Weighted Average Cost of Capital (WACC), featuring parameters such as Beta, risk-free rate, and share price.
- DCF Valuation (Unlevered and Levered): Customizable Discounted Cash Flow models that illustrate intrinsic value along with comprehensive calculations.
- Financial Statements: Pre-loaded annual and quarterly financial statements to facilitate thorough analysis.
- Key Ratios: Includes a range of profitability, leverage, and efficiency ratios for Cofinimmo SA (COFBBR).
- Dashboard and Charts: Visual representations of valuation metrics and assumptions for easy result analysis.
Disclaimer
All information, articles, and product details provided on this website are for general informational and educational purposes only. We do not claim any ownership over, nor do we intend to infringe upon, any trademarks, copyrights, logos, brand names, or other intellectual property mentioned or depicted on this site. Such intellectual property remains the property of its respective owners, and any references here are made solely for identification or informational purposes, without implying any affiliation, endorsement, or partnership.
We make no representations or warranties, express or implied, regarding the accuracy, completeness, or suitability of any content or products presented. Nothing on this website should be construed as legal, tax, investment, financial, medical, or other professional advice. In addition, no part of this site—including articles or product references—constitutes a solicitation, recommendation, endorsement, advertisement, or offer to buy or sell any securities, franchises, or other financial instruments, particularly in jurisdictions where such activity would be unlawful.
All content is of a general nature and may not address the specific circumstances of any individual or entity. It is not a substitute for professional advice or services. Any actions you take based on the information provided here are strictly at your own risk. You accept full responsibility for any decisions or outcomes arising from your use of this website and agree to release us from any liability in connection with your use of, or reliance upon, the content or products found herein.