
|
Coforge Limited (Coforge.NS) DCF -Bewertung |
Fully Editable: Tailor To Your Needs In Excel Or Sheets
Professional Design: Trusted, Industry-Standard Templates
Investor-Approved Valuation Models
MAC/PC Compatible, Fully Unlocked
No Expertise Is Needed; Easy To Follow
Coforge Limited (COFORGE.NS) Bundle
Entdecken Sie den wahren Wert von Coforge Limited mit unserem DCF-Taschenrechner von Professional Grade! Passen Sie die wichtigsten Annahmen an, erkunden Sie verschiedene Szenarien und bewerten Sie, wie sich Änderungen auf die Bewertung von Coforge Limited auswirken - alles innerhalb einer Excel -Vorlage.
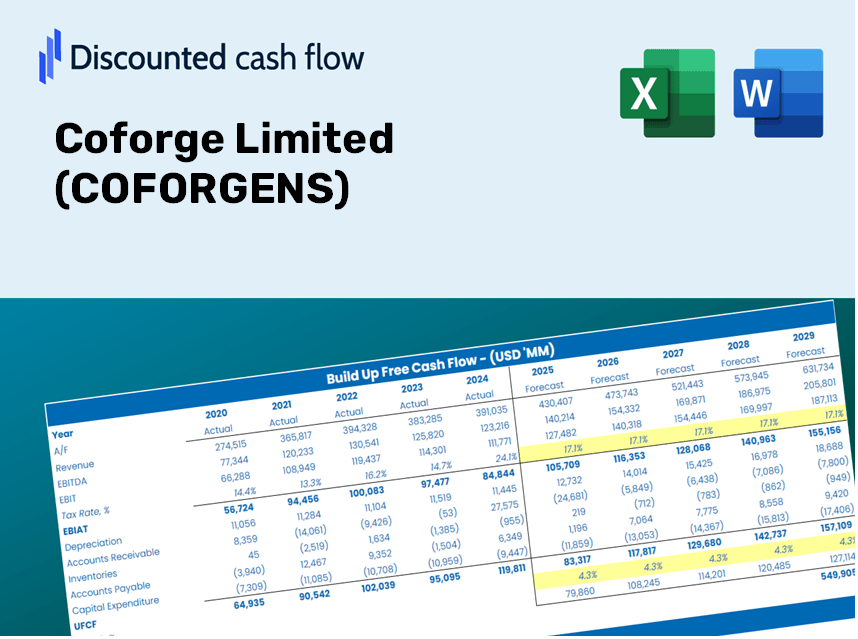
Discounted Cash Flow (DCF) - (USD MM)
| Year | AY1 2021 |
AY2 2022 |
AY3 2023 |
AY4 2024 |
AY5 2025 |
FY1 2026 |
FY2 2027 |
FY3 2028 |
FY4 2029 |
FY5 2030 |
|---|---|---|---|---|---|---|---|---|---|---|
| Revenue | 46,628.0 | 64,320.0 | 80,146.0 | 90,089.0 | 120,507.0 | 153,260.3 | 194,915.9 | 247,893.3 | 315,269.8 | 400,958.9 |
| Revenue Growth, % | 0 | 37.94 | 24.61 | 12.41 | 33.76 | 27.18 | 27.18 | 27.18 | 27.18 | 27.18 |
| EBITDA | 7,849.0 | 11,407.0 | 12,733.0 | 14,612.0 | 17,344.0 | 24,848.8 | 31,602.6 | 40,192.1 | 51,116.1 | 65,009.3 |
| EBITDA, % | 16.83 | 17.73 | 15.89 | 16.22 | 14.39 | 16.21 | 16.21 | 16.21 | 16.21 | 16.21 |
| Depreciation | 1,836.0 | 2,272.0 | 2,585.0 | 2,972.0 | 4,683.0 | 5,480.7 | 6,970.3 | 8,864.8 | 11,274.2 | 14,338.5 |
| Depreciation, % | 3.94 | 3.53 | 3.23 | 3.3 | 3.89 | 3.58 | 3.58 | 3.58 | 3.58 | 3.58 |
| EBIT | 6,013.0 | 9,135.0 | 10,148.0 | 11,640.0 | 12,661.0 | 19,368.1 | 24,632.3 | 31,327.3 | 39,841.9 | 50,670.8 |
| EBIT, % | 12.9 | 14.2 | 12.66 | 12.92 | 10.51 | 12.64 | 12.64 | 12.64 | 12.64 | 12.64 |
| Total Cash | 8,229.0 | 4,535.0 | 5,764.0 | 3,352.0 | 10,289.0 | 13,532.8 | 17,210.9 | 21,888.8 | 27,838.1 | 35,404.4 |
| Total Cash, percent | .0 | .0 | .0 | .0 | .0 | .0 | .0 | .0 | .0 | .0 |
| Account Receivables | 11,333.0 | 15,078.0 | 17,667.0 | 19,830.0 | 28,197.0 | 35,311.5 | 44,909.0 | 57,115.1 | 72,638.8 | 92,381.7 |
| Account Receivables, % | 24.31 | 23.44 | 22.04 | 22.01 | 23.4 | 23.04 | 23.04 | 23.04 | 23.04 | 23.04 |
| Inventories | .0 | 1,806.0 | -24.0 | 329.0 | .0 | 963.4 | 1,225.3 | 1,558.3 | 1,981.8 | 2,520.5 |
| Inventories, % | 0 | 2.81 | -0.02994535 | 0.36519 | 0 | 0.62862 | 0.62862 | 0.62862 | 0.62862 | 0.62862 |
| Accounts Payable | 3,398.0 | 6,160.0 | 6,481.0 | 8,062.0 | 9,883.0 | 12,904.9 | 16,412.4 | 20,873.2 | 26,546.5 | 33,761.7 |
| Accounts Payable, % | 7.29 | 9.58 | 8.09 | 8.95 | 8.2 | 8.42 | 8.42 | 8.42 | 8.42 | 8.42 |
| Capital Expenditure | -782.0 | -1,541.0 | -1,582.0 | -2,655.0 | -6,144.0 | -4,319.6 | -5,493.7 | -6,986.8 | -8,885.8 | -11,300.9 |
| Capital Expenditure, % | -1.68 | -2.4 | -1.97 | -2.95 | -5.1 | -2.82 | -2.82 | -2.82 | -2.82 | -2.82 |
| Tax Rate, % | 37.34 | 37.34 | 37.34 | 37.34 | 37.34 | 37.34 | 37.34 | 37.34 | 37.34 | 37.34 |
| EBITAT | 4,595.0 | 7,016.4 | 7,401.9 | 8,791.5 | 7,933.0 | 14,113.6 | 17,949.6 | 22,828.2 | 29,032.8 | 36,923.8 |
| Depreciation | ||||||||||
| Changes in Account Receivables | ||||||||||
| Changes in Inventories | ||||||||||
| Changes in Accounts Payable | ||||||||||
| Capital Expenditure | ||||||||||
| UFCF | -2,286.0 | 4,958.4 | 7,966.9 | 8,173.5 | 255.0 | 10,218.6 | 13,074.3 | 16,627.9 | 21,147.3 | 26,895.0 |
| WACC, % | 5.01 | 5.01 | 5 | 5.01 | 4.98 | 5 | 5 | 5 | 5 | 5 |
| PV UFCF | ||||||||||
| SUM PV UFCF | 74,415.3 | |||||||||
| Long Term Growth Rate, % | 4.00 | |||||||||
| Free cash flow (T + 1) | 27,971 | |||||||||
| Terminal Value | 2,785,350 | |||||||||
| Present Terminal Value | 2,181,957 | |||||||||
| Enterprise Value | 2,256,372 | |||||||||
| Net Debt | 1,872 | |||||||||
| Equity Value | 2,254,500 | |||||||||
| Diluted Shares Outstanding, MM | 333 | |||||||||
| Equity Value Per Share | 6,775.46 |
What You Will Receive
- Pre-Configured Financial Model: Coforge Limited’s actual data allows for accurate DCF valuation.
- Comprehensive Forecast Customization: Modify revenue growth, profit margins, WACC, and other essential parameters.
- Instantaneous Calculations: Automated updates reflect changes in real-time, showcasing immediate results.
- Investor-Ready Format: A polished Excel template crafted for high-caliber valuation.
- Adaptable and Reusable: Designed for versatility, enabling repeated application for in-depth forecasts.
Highlighted Features
- Customizable Forecast Inputs: Adjust essential parameters such as revenue growth, EBITDA margin, and capital investments.
- Instant DCF Valuation: Quickly computes intrinsic value, NPV, and other financial metrics.
- High-Precision Accuracy: Incorporates real-world financial data from Coforge Limited for credible valuation results.
- Simplified Scenario Analysis: Easily explore various assumptions and evaluate their impacts.
- Efficiency Booster: Avoid the hassle of creating intricate valuation models from the ground up.
How It Works
- Step 1: Download the Excel file.
- Step 2: Review Coforge Limited’s (COFORGENS) pre-filled financial data and forecasts.
- Step 3: Adjust key inputs such as revenue growth, WACC, and tax rates (cells highlighted for easy identification).
- Step 4: Observe the DCF model update in real-time as you modify your assumptions.
- Step 5: Evaluate the results and leverage the insights for your investment decisions.
Why Choose This Calculator for Coforge Limited (COFORGENS)?
- All-in-One Solution: Combines DCF, WACC, and financial ratio analysis for comprehensive evaluations.
- Flexible Inputs: Modify the yellow-highlighted fields to explore different scenarios.
- In-Depth Analysis: Automatically computes Coforge’s intrinsic value and Net Present Value.
- Preloaded Information: Access to historical and projected data for reliable baseline assessments.
- High Professional Standards: Perfect for financial analysts, investors, and business consultants.
Who Can Benefit From This Product?
- Individual Investors: Gain insights to make well-informed decisions regarding buying or selling Coforge Limited (COFORGENS) stock.
- Financial Analysts: Enhance valuation workflows with ready-to-implement financial models tailored for Coforge Limited (COFORGENS).
- Consultants: Provide clients with accurate and timely valuation insights focused on Coforge Limited (COFORGENS).
- Business Owners: Learn how major firms like Coforge Limited (COFORGENS) are valued to inform your own business strategies.
- Finance Students: Explore valuation methods using real-time data and practical examples related to Coforge Limited (COFORGENS).
Contents of the Template
- Preloaded COFORGENS Data: Historical and projected financial information, including revenue, EBIT, and capital expenditures.
- DCF and WACC Models: Professional-grade spreadsheets for calculating intrinsic value and Weighted Average Cost of Capital.
- Editable Inputs: Yellow-highlighted cells for modifying revenue growth, tax rates, and discount rates.
- Financial Statements: Detailed annual and quarterly financials for in-depth analysis.
- Key Ratios: Metrics for profitability, leverage, and efficiency to assess performance.
- Dashboard and Charts: Visual representations of valuation results and underlying assumptions.
Disclaimer
All information, articles, and product details provided on this website are for general informational and educational purposes only. We do not claim any ownership over, nor do we intend to infringe upon, any trademarks, copyrights, logos, brand names, or other intellectual property mentioned or depicted on this site. Such intellectual property remains the property of its respective owners, and any references here are made solely for identification or informational purposes, without implying any affiliation, endorsement, or partnership.
We make no representations or warranties, express or implied, regarding the accuracy, completeness, or suitability of any content or products presented. Nothing on this website should be construed as legal, tax, investment, financial, medical, or other professional advice. In addition, no part of this site—including articles or product references—constitutes a solicitation, recommendation, endorsement, advertisement, or offer to buy or sell any securities, franchises, or other financial instruments, particularly in jurisdictions where such activity would be unlawful.
All content is of a general nature and may not address the specific circumstances of any individual or entity. It is not a substitute for professional advice or services. Any actions you take based on the information provided here are strictly at your own risk. You accept full responsibility for any decisions or outcomes arising from your use of this website and agree to release us from any liability in connection with your use of, or reliance upon, the content or products found herein.