
|
Container Corporation of India Limited (Concor.NS) DCF -Bewertung |
Fully Editable: Tailor To Your Needs In Excel Or Sheets
Professional Design: Trusted, Industry-Standard Templates
Investor-Approved Valuation Models
MAC/PC Compatible, Fully Unlocked
No Expertise Is Needed; Easy To Follow
Container Corporation of India Limited (CONCOR.NS) Bundle
Unser (Concorns) DCF -Taschenrechner wurde für die Genauigkeit entwickelt und ermöglicht es Ihnen, die Bewertung der Container Corporation of India Limited mit authentischen Finanzdaten zu bewerten und alle wesentlichen Parameter für verbesserte Projektionen zu ändern.
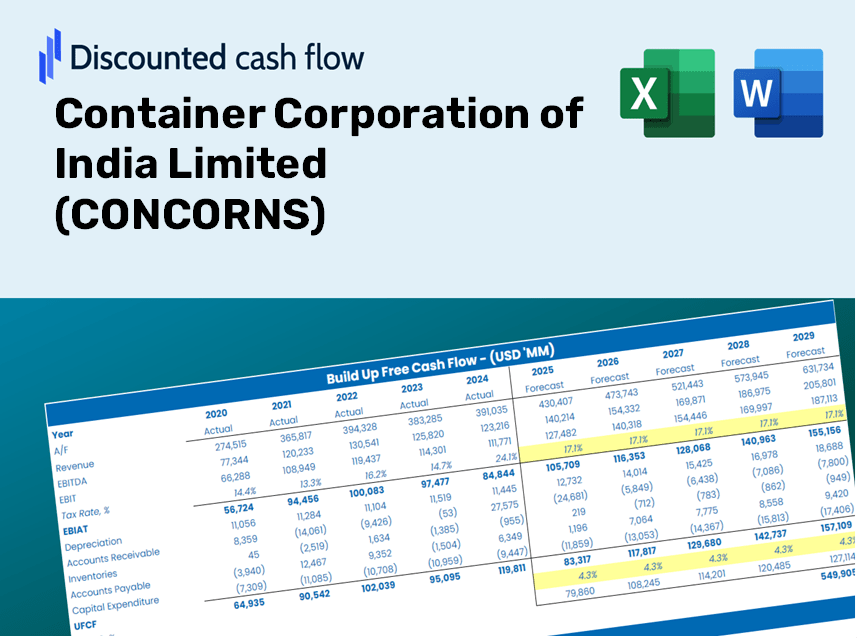
Discounted Cash Flow (DCF) - (USD MM)
| Year | AY1 2021 |
AY2 2022 |
AY3 2023 |
AY4 2024 |
AY5 2025 |
FY1 2026 |
FY2 2027 |
FY3 2028 |
FY4 2029 |
FY5 2030 |
|---|---|---|---|---|---|---|---|---|---|---|
| Revenue | 64,270.8 | 76,738.0 | 82,159.9 | 86,534.1 | 88,870.2 | 96,532.4 | 104,855.2 | 113,895.5 | 123,715.3 | 134,381.7 |
| Revenue Growth, % | 0 | 19.4 | 7.07 | 5.32 | 2.7 | 8.62 | 8.62 | 8.62 | 8.62 | 8.62 |
| EBITDA | 9,641.3 | 17,116.6 | 18,299.0 | 18,436.0 | 17,797.5 | 19,482.2 | 21,161.9 | 22,986.4 | 24,968.2 | 27,120.9 |
| EBITDA, % | 15 | 22.31 | 22.27 | 21.3 | 20.03 | 20.18 | 20.18 | 20.18 | 20.18 | 20.18 |
| Depreciation | 4,706.3 | 4,821.3 | 4,717.6 | 4,882.9 | 4,152.9 | 5,726.9 | 6,220.7 | 6,757.0 | 7,339.6 | 7,972.4 |
| Depreciation, % | 7.32 | 6.28 | 5.74 | 5.64 | 4.67 | 5.93 | 5.93 | 5.93 | 5.93 | 5.93 |
| EBIT | 4,935.0 | 12,295.3 | 13,581.4 | 13,553.1 | 13,644.6 | 13,755.3 | 14,941.2 | 16,229.4 | 17,628.7 | 19,148.6 |
| EBIT, % | 7.68 | 16.02 | 16.53 | 15.66 | 15.35 | 14.25 | 14.25 | 14.25 | 14.25 | 14.25 |
| Total Cash | 25,125.1 | 28,993.5 | 31,987.7 | 32,601.7 | 37,731.0 | 37,829.1 | 41,090.6 | 44,633.3 | 48,481.5 | 52,661.5 |
| Total Cash, percent | .0 | .0 | .0 | .0 | .0 | .0 | .0 | .0 | .0 | .0 |
| Account Receivables | 6,330.1 | 6,797.9 | 7,925.0 | 3,336.3 | 4,161.4 | 7,122.5 | 7,736.5 | 8,403.6 | 9,128.1 | 9,915.1 |
| Account Receivables, % | 9.85 | 8.86 | 9.65 | 3.86 | 4.68 | 7.38 | 7.38 | 7.38 | 7.38 | 7.38 |
| Inventories | 239.7 | 306.8 | 371.8 | 502.2 | 499.3 | 457.1 | 496.5 | 539.3 | 585.8 | 636.3 |
| Inventories, % | 0.37295 | 0.3998 | 0.45253 | 0.58035 | 0.56183 | 0.47349 | 0.47349 | 0.47349 | 0.47349 | 0.47349 |
| Accounts Payable | 2,692.7 | 4,222.9 | 3,821.2 | 2,810.1 | 2,243.0 | 3,883.5 | 4,218.3 | 4,582.0 | 4,977.0 | 5,406.1 |
| Accounts Payable, % | 4.19 | 5.5 | 4.65 | 3.25 | 2.52 | 4.02 | 4.02 | 4.02 | 4.02 | 4.02 |
| Capital Expenditure | -5,890.5 | -7,873.5 | -6,544.7 | -7,979.3 | -9,082.7 | -9,041.7 | -9,821.2 | -10,668.0 | -11,587.8 | -12,586.8 |
| Capital Expenditure, % | -9.17 | -10.26 | -7.97 | -9.22 | -10.22 | -9.37 | -9.37 | -9.37 | -9.37 | -9.37 |
| Tax Rate, % | 25.11 | 25.11 | 25.11 | 25.11 | 25.11 | 25.11 | 25.11 | 25.11 | 25.11 | 25.11 |
| EBITAT | 3,701.3 | 9,305.9 | 10,199.1 | 10,212.1 | 10,218.8 | 10,344.6 | 11,236.5 | 12,205.3 | 13,257.6 | 14,400.6 |
| Depreciation | ||||||||||
| Changes in Account Receivables | ||||||||||
| Changes in Inventories | ||||||||||
| Changes in Accounts Payable | ||||||||||
| Capital Expenditure | ||||||||||
| UFCF | -1,360.1 | 7,249.0 | 6,778.2 | 10,562.9 | 3,899.7 | 5,751.5 | 7,317.3 | 7,948.1 | 8,633.4 | 9,377.8 |
| WACC, % | 4.57 | 4.57 | 4.57 | 4.57 | 4.57 | 4.57 | 4.57 | 4.57 | 4.57 | 4.57 |
| PV UFCF | ||||||||||
| SUM PV UFCF | 33,860.8 | |||||||||
| Long Term Growth Rate, % | 3.50 | |||||||||
| Free cash flow (T + 1) | 9,706 | |||||||||
| Terminal Value | 905,176 | |||||||||
| Present Terminal Value | 723,853 | |||||||||
| Enterprise Value | 757,714 | |||||||||
| Net Debt | -28,016 | |||||||||
| Equity Value | 785,730 | |||||||||
| Diluted Shares Outstanding, MM | 762 | |||||||||
| Equity Value Per Share | 1,031.65 |
Benefits of Choosing Us
- Comprehensive CONCORNS Financial Data: Pre-populated with Container Corporation of India Limited’s historical and projected financials for accurate analysis.
- Customizable Template: Easily adjust key metrics such as revenue growth, WACC, and EBITDA %.
- Instantaneous Calculations: Witness the immediate update of CONCORNS's intrinsic value as you make changes.
- Expert Valuation Tool: Tailored for investors, analysts, and consultants in search of reliable DCF outcomes.
- Intuitive Design: Clear layout and straightforward instructions suitable for users of all skill levels.
Key Features
- Comprehensive Financial Data: Access precise historical figures and future forecasts for Container Corporation of India Limited (CONCORNS).
- Adjustable Forecast Parameters: Modify highlighted fields such as WACC, growth rates, and profit margins.
- Real-Time Calculations: Automatic updates for DCF, Net Present Value (NPV), and cash flow assessments.
- User-Friendly Dashboard: Clear charts and summaries to help visualize your valuation outcomes.
- Designed for All Skill Levels: An intuitive format suitable for investors, CFOs, and consultants alike.
How It Functions
- Step 1: Download the Excel spreadsheet.
- Step 2: Examine the pre-filled financial data and projections for Container Corporation of India Limited (CONCORNS).
- Step 3: Adjust key inputs such as revenue growth, WACC, and tax rates (highlighted cells).
- Step 4: Observe the DCF model refresh in real-time as you modify your assumptions.
- Step 5: Evaluate the results and leverage the findings for your investment strategies.
Why Choose the CONCORNS Calculator?
- Time-Saving: Eliminate the hassle of building a DCF model from the ground up – it’s fully prepared for immediate use.
- Enhanced Accuracy: Dependable financial data and formulas minimize valuation errors.
- Completely Customizable: Adjust the model to align with your specific assumptions and forecasts.
- User-Friendly: Intuitive charts and outputs facilitate easy analysis of the results.
- Preferred by Professionals: Crafted for experts who prioritize precision and user experience.
Who Can Benefit from This Product?
- Professional Investors: Develop comprehensive and trustworthy valuation models for portfolio assessment related to Container Corporation of India Limited (CONCORNS).
- Corporate Finance Teams: Evaluate varying valuation scenarios to inform internal strategies for CONCORNS.
- Consultants and Advisors: Deliver precise valuation insights to clients regarding the stock of Container Corporation of India Limited (CONCORNS).
- Students and Educators: Leverage real-world data to enhance learning and practice in financial modeling with a focus on CONCORNS.
- Logistics and Supply Chain Enthusiasts: Gain insights into the valuation of logistics firms like Container Corporation of India Limited (CONCORNS) within the market.
Contents of the Template
- Historical Data: Provides past financial information and baseline forecasts for Container Corporation of India Limited (CONCORNS).
- DCF and Levered DCF Models: Comprehensive templates to assess the intrinsic value of Container Corporation of India Limited (CONCORNS).
- WACC Sheet: Pre-structured calculations for the Weighted Average Cost of Capital.
- Editable Inputs: Adjust essential drivers such as growth rates, EBITDA %, and CAPEX estimates.
- Quarterly and Annual Statements: A thorough breakdown of Container Corporation of India Limited's (CONCORNS) financial performance.
- Interactive Dashboard: Dynamically visualize valuation results and future projections.
Disclaimer
All information, articles, and product details provided on this website are for general informational and educational purposes only. We do not claim any ownership over, nor do we intend to infringe upon, any trademarks, copyrights, logos, brand names, or other intellectual property mentioned or depicted on this site. Such intellectual property remains the property of its respective owners, and any references here are made solely for identification or informational purposes, without implying any affiliation, endorsement, or partnership.
We make no representations or warranties, express or implied, regarding the accuracy, completeness, or suitability of any content or products presented. Nothing on this website should be construed as legal, tax, investment, financial, medical, or other professional advice. In addition, no part of this site—including articles or product references—constitutes a solicitation, recommendation, endorsement, advertisement, or offer to buy or sell any securities, franchises, or other financial instruments, particularly in jurisdictions where such activity would be unlawful.
All content is of a general nature and may not address the specific circumstances of any individual or entity. It is not a substitute for professional advice or services. Any actions you take based on the information provided here are strictly at your own risk. You accept full responsibility for any decisions or outcomes arising from your use of this website and agree to release us from any liability in connection with your use of, or reliance upon, the content or products found herein.