
|
Cumberland Pharmaceuticals Inc. (CPIX) DCF -Bewertung |
Fully Editable: Tailor To Your Needs In Excel Or Sheets
Professional Design: Trusted, Industry-Standard Templates
Investor-Approved Valuation Models
MAC/PC Compatible, Fully Unlocked
No Expertise Is Needed; Easy To Follow
Cumberland Pharmaceuticals Inc. (CPIX) Bundle
Sparen Sie Zeit und verbessern Sie die Präzision mit unserem [CPIX] DCF -Taschenrechner! Mit Daten und anpassbaren Annahmen von Real Cumberland Pharmaceuticals Inc. können Sie Cumberland Pharmaceuticals wie ein erfahrener Investor prognostizieren, analysieren und bewerten.
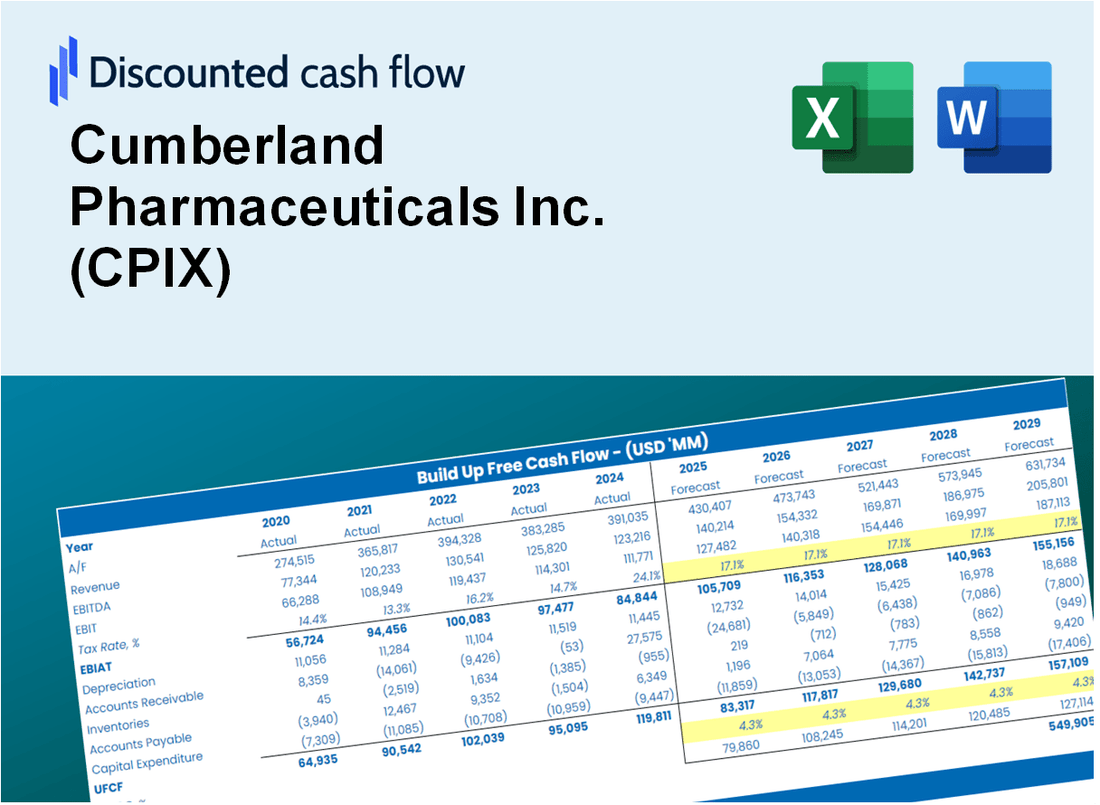
Discounted Cash Flow (DCF) - (USD MM)
| Year | AY1 2020 |
AY2 2021 |
AY3 2022 |
AY4 2023 |
AY5 2024 |
FY1 2025 |
FY2 2026 |
FY3 2027 |
FY4 2028 |
FY5 2029 |
|---|---|---|---|---|---|---|---|---|---|---|
| Revenue | 37.4 | 36.0 | 42.0 | 39.6 | 37.9 | 38.1 | 38.4 | 38.7 | 38.9 | 39.2 |
| Revenue Growth, % | 0 | -3.89 | 16.75 | -5.85 | -4.26 | 0.6864 | 0.6864 | 0.6864 | 0.6864 | 0.6864 |
| EBITDA | -1.6 | -.9 | .3 | 2.5 | .2 | .1 | .1 | .1 | .1 | .1 |
| EBITDA, % | -4.16 | -2.38 | 0.79246 | 6.28 | 0.48173 | 0.20281 | 0.20281 | 0.20281 | 0.20281 | 0.20281 |
| Depreciation | 4.7 | 4.6 | 5.3 | 8.1 | 6.0 | 5.7 | 5.7 | 5.8 | 5.8 | 5.8 |
| Depreciation, % | 12.68 | 12.8 | 12.68 | 20.49 | 15.96 | 14.92 | 14.92 | 14.92 | 14.92 | 14.92 |
| EBIT | -6.3 | -5.5 | -5.0 | -5.6 | -5.9 | -5.6 | -5.7 | -5.7 | -5.7 | -5.8 |
| EBIT, % | -16.84 | -15.18 | -11.89 | -14.2 | -15.48 | -14.72 | -14.72 | -14.72 | -14.72 | -14.72 |
| Total Cash | 24.8 | 27.0 | 19.8 | 18.3 | 18.0 | 21.5 | 21.7 | 21.8 | 22.0 | 22.1 |
| Total Cash, percent | .0 | .0 | .0 | .0 | .0 | .0 | .0 | .0 | .0 | .0 |
| Account Receivables | 12.4 | 6.9 | 13.2 | 9.8 | 11.7 | 10.6 | 10.7 | 10.8 | 10.8 | 10.9 |
| Account Receivables, % | 33.06 | 19.11 | 31.33 | 24.67 | 30.9 | 27.82 | 27.82 | 27.82 | 27.82 | 27.82 |
| Inventories | 10.6 | 8.4 | 9.9 | 4.6 | 4.0 | 7.4 | 7.5 | 7.5 | 7.6 | 7.6 |
| Inventories, % | 28.41 | 23.43 | 23.48 | 11.65 | 10.56 | 19.51 | 19.51 | 19.51 | 19.51 | 19.51 |
| Accounts Payable | 13.4 | 9.6 | 10.8 | 14.0 | 13.9 | 12.2 | 12.3 | 12.4 | 12.5 | 12.6 |
| Accounts Payable, % | 35.78 | 26.79 | 25.75 | 35.49 | 36.74 | 32.11 | 32.11 | 32.11 | 32.11 | 32.11 |
| Capital Expenditure | -2.1 | -.4 | -2.1 | -.5 | -.2 | -1.0 | -1.0 | -1.0 | -1.0 | -1.0 |
| Capital Expenditure, % | -5.65 | -0.98503 | -4.94 | -1.15 | -0.47458 | -2.64 | -2.64 | -2.64 | -2.64 | -2.64 |
| Tax Rate, % | -0.20701 | -0.20701 | -0.20701 | -0.20701 | -0.20701 | -0.20701 | -0.20701 | -0.20701 | -0.20701 | -0.20701 |
| EBITAT | -3.2 | -3.4 | -5.0 | -5.6 | -5.9 | -4.6 | -4.7 | -4.7 | -4.7 | -4.8 |
| Depreciation | ||||||||||
| Changes in Account Receivables | ||||||||||
| Changes in Inventories | ||||||||||
| Changes in Accounts Payable | ||||||||||
| Capital Expenditure | ||||||||||
| UFCF | -10.2 | 4.8 | -8.3 | 13.9 | -1.5 | -4.0 | .0 | .0 | .0 | .0 |
| WACC, % | 3.54 | 3.73 | 4.29 | 4.3 | 4.3 | 4.03 | 4.03 | 4.03 | 4.03 | 4.03 |
| PV UFCF | ||||||||||
| SUM PV UFCF | -3.8 | |||||||||
| Long Term Growth Rate, % | 2.00 | |||||||||
| Free cash flow (T + 1) | 0 | |||||||||
| Terminal Value | 0 | |||||||||
| Present Terminal Value | 0 | |||||||||
| Enterprise Value | -4 | |||||||||
| Net Debt | 3 | |||||||||
| Equity Value | -6 | |||||||||
| Diluted Shares Outstanding, MM | 14 | |||||||||
| Equity Value Per Share | -0.45 |
What You Will Get
- Real Cumberland Data: Preloaded financials – from revenue to EBIT – based on actual and projected figures for Cumberland Pharmaceuticals Inc. (CPIX).
- Full Customization: Adjust all critical parameters (yellow cells) like WACC, growth %, and tax rates for Cumberland Pharmaceuticals Inc. (CPIX).
- Instant Valuation Updates: Automatic recalculations to analyze the impact of changes on Cumberland Pharmaceuticals Inc. (CPIX)’s fair value.
- Versatile Excel Template: Tailored for quick edits, scenario testing, and detailed projections specific to Cumberland Pharmaceuticals Inc. (CPIX).
- Time-Saving and Accurate: Skip building models from scratch while maintaining precision and flexibility for Cumberland Pharmaceuticals Inc. (CPIX).
Key Features
- Real-Life CPIX Data: Pre-filled with Cumberland Pharmaceuticals’ historical financials and forward-looking projections.
- Fully Customizable Inputs: Adjust revenue growth, margins, WACC, tax rates, and capital expenditures.
- Dynamic Valuation Model: Automatic updates to Net Present Value (NPV) and intrinsic value based on your inputs.
- Scenario Testing: Create multiple forecast scenarios to analyze different valuation outcomes.
- User-Friendly Design: Simple, structured, and designed for professionals and beginners alike.
How It Works
- Download: Get the pre-built Excel file containing Cumberland Pharmaceuticals Inc.'s (CPIX) financial data.
- Customize: Modify projections, such as revenue growth, EBITDA %, and WACC.
- Update Automatically: The intrinsic value and NPV calculations refresh in real-time.
- Test Scenarios: Generate various forecasts and evaluate results instantly.
- Make Decisions: Leverage the valuation insights to inform your investment choices.
Why Choose This Calculator for Cumberland Pharmaceuticals Inc. (CPIX)?
- Designed for Industry Experts: A sophisticated tool tailored for analysts, CFOs, and healthcare consultants.
- Accurate Data Integration: Historical and projected financials for Cumberland Pharmaceuticals preloaded for precision.
- Flexible Scenario Analysis: Effortlessly test various forecasts and assumptions.
- Comprehensive Outputs: Automatically computes intrinsic value, NPV, and essential financial metrics.
- User-Friendly Interface: Step-by-step guidance ensures a seamless experience.
Who Should Use This Product?
- Healthcare Investors: Develop comprehensive valuation models for assessing Cumberland Pharmaceuticals Inc. (CPIX) stock.
- Pharmaceutical Finance Teams: Evaluate valuation scenarios to inform corporate strategies and decisions.
- Consultants and Advisors: Deliver precise valuation insights for clients interested in Cumberland Pharmaceuticals Inc. (CPIX).
- Students and Educators: Utilize real-world data to enhance learning in financial modeling and analysis.
- Biotech Enthusiasts: Gain insights into how pharmaceutical companies like Cumberland Pharmaceuticals Inc. (CPIX) are valued in the market.
What the Template Contains
- Operating and Balance Sheet Data: Pre-filled Cumberland Pharmaceuticals Inc. (CPIX) historical data and forecasts, including revenue, EBITDA, EBIT, and capital expenditures.
- WACC Calculation: A dedicated sheet for Weighted Average Cost of Capital (WACC), including parameters like Beta, risk-free rate, and share price.
- DCF Valuation (Unlevered and Levered): Editable Discounted Cash Flow models showing intrinsic value with detailed calculations.
- Financial Statements: Pre-loaded financial statements (annual and quarterly) to support analysis.
- Key Ratios: Includes profitability, leverage, and efficiency ratios for Cumberland Pharmaceuticals Inc. (CPIX).
- Dashboard and Charts: Visual summary of valuation outputs and assumptions to analyze results easily.
Disclaimer
All information, articles, and product details provided on this website are for general informational and educational purposes only. We do not claim any ownership over, nor do we intend to infringe upon, any trademarks, copyrights, logos, brand names, or other intellectual property mentioned or depicted on this site. Such intellectual property remains the property of its respective owners, and any references here are made solely for identification or informational purposes, without implying any affiliation, endorsement, or partnership.
We make no representations or warranties, express or implied, regarding the accuracy, completeness, or suitability of any content or products presented. Nothing on this website should be construed as legal, tax, investment, financial, medical, or other professional advice. In addition, no part of this site—including articles or product references—constitutes a solicitation, recommendation, endorsement, advertisement, or offer to buy or sell any securities, franchises, or other financial instruments, particularly in jurisdictions where such activity would be unlawful.
All content is of a general nature and may not address the specific circumstances of any individual or entity. It is not a substitute for professional advice or services. Any actions you take based on the information provided here are strictly at your own risk. You accept full responsibility for any decisions or outcomes arising from your use of this website and agree to release us from any liability in connection with your use of, or reliance upon, the content or products found herein.