
|
CRA International, Inc. (CRAI) DCF -Bewertung |
Fully Editable: Tailor To Your Needs In Excel Or Sheets
Professional Design: Trusted, Industry-Standard Templates
Investor-Approved Valuation Models
MAC/PC Compatible, Fully Unlocked
No Expertise Is Needed; Easy To Follow
CRA International, Inc. (CRAI) Bundle
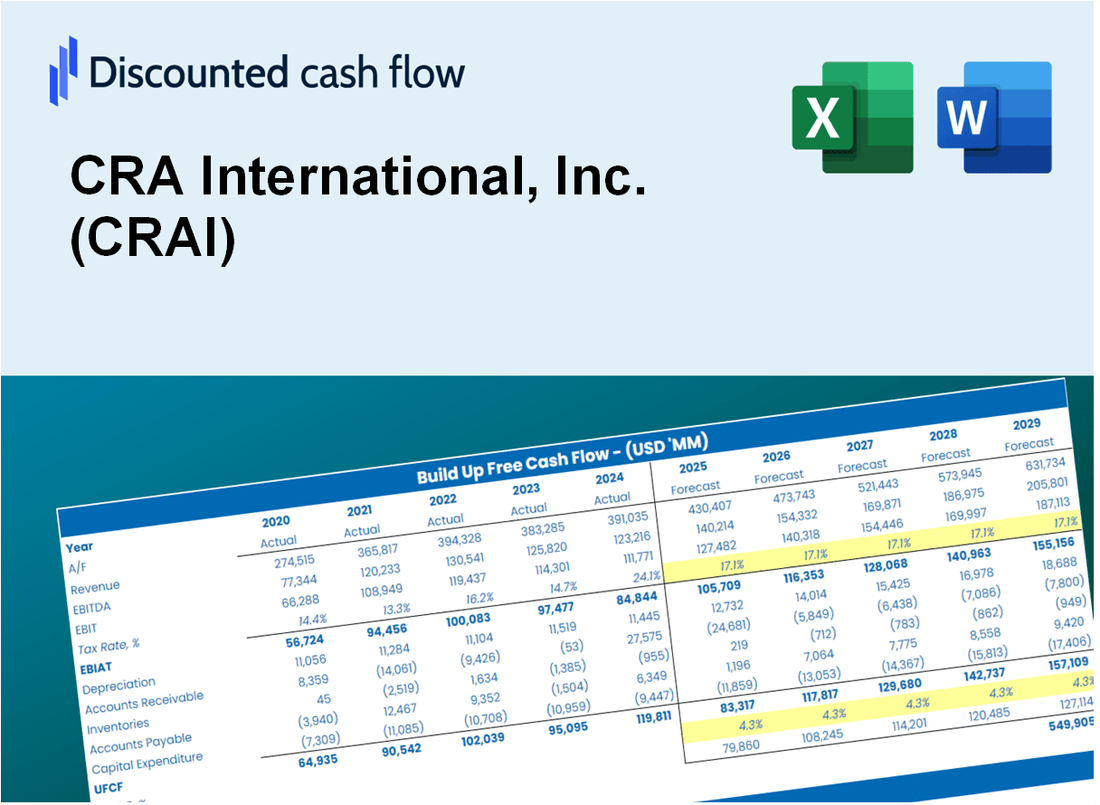
Gewinnen Sie Einblicke in Ihre Bewertungsanalyse für CRA International, Inc. (CRAI) mit unserem hochmodernen DCF-Taschenrechner! Diese Excel -Vorlage wird mit tatsächlichen CRAI -Daten vorgeladen, sodass Sie Prognosen und Annahmen anpassen können, um den inneren Wert von CRA International, Inc. (CRAI) genau zu bestimmen.
Discounted Cash Flow (DCF) - (USD MM)
| Year | AY1 2020 |
AY2 2021 |
AY3 2022 |
AY4 2023 |
AY5 2024 |
FY1 2025 |
FY2 2026 |
FY3 2027 |
FY4 2028 |
FY5 2029 |
|---|---|---|---|---|---|---|---|---|---|---|
| Revenue | 508.4 | 565.9 | 590.9 | 624.0 | 687.4 | 741.5 | 799.9 | 862.9 | 930.9 | 1,004.2 |
| Revenue Growth, % | 0 | 11.32 | 4.41 | 5.6 | 10.17 | 7.87 | 7.87 | 7.87 | 7.87 | 7.87 |
| EBITDA | 59.7 | 81.0 | 86.4 | 81.9 | 97.5 | 100.8 | 108.8 | 117.3 | 126.6 | 136.6 |
| EBITDA, % | 11.75 | 14.32 | 14.62 | 13.13 | 14.18 | 13.6 | 13.6 | 13.6 | 13.6 | 13.6 |
| Depreciation | 24.9 | 25.8 | 25.8 | 25.8 | 26.8 | 32.4 | 35.0 | 37.7 | 40.7 | 43.9 |
| Depreciation, % | 4.89 | 4.56 | 4.36 | 4.14 | 3.9 | 4.37 | 4.37 | 4.37 | 4.37 | 4.37 |
| EBIT | 34.8 | 55.2 | 60.6 | 56.1 | 70.7 | 68.4 | 73.8 | 79.6 | 85.9 | 92.7 |
| EBIT, % | 6.85 | 9.76 | 10.26 | 8.99 | 10.28 | 9.23 | 9.23 | 9.23 | 9.23 | 9.23 |
| Total Cash | 45.7 | 66.1 | 31.4 | 45.6 | 26.7 | 55.1 | 59.5 | 64.2 | 69.2 | 74.7 |
| Total Cash, percent | .0 | .0 | .0 | .0 | .0 | .0 | .0 | .0 | .0 | .0 |
| Account Receivables | 152.5 | 162.1 | 195.0 | 208.3 | 226.1 | 234.2 | 252.6 | 272.5 | 294.0 | 317.1 |
| Account Receivables, % | 29.99 | 28.64 | 33 | 33.39 | 32.89 | 31.58 | 31.58 | 31.58 | 31.58 | 31.58 |
| Inventories | .0 | .0 | .0 | .0 | .0 | .0 | .0 | .0 | .0 | .0 |
| Inventories, % | 0 | 0 | 0 | 0 | 0 | 0 | 0 | 0 | 0 | 0 |
| Accounts Payable | 19.4 | 23.5 | 27.6 | 28.7 | 28.2 | 31.6 | 34.1 | 36.8 | 39.7 | 42.9 |
| Accounts Payable, % | 3.82 | 4.15 | 4.67 | 4.6 | 4.1 | 4.27 | 4.27 | 4.27 | 4.27 | 4.27 |
| Capital Expenditure | -17.1 | -2.6 | -3.8 | -2.4 | -16.6 | -10.8 | -11.6 | -12.5 | -13.5 | -14.6 |
| Capital Expenditure, % | -3.36 | -0.46348 | -0.64529 | -0.37918 | -2.42 | -1.45 | -1.45 | -1.45 | -1.45 | -1.45 |
| Tax Rate, % | 29.57 | 29.57 | 29.57 | 29.57 | 29.57 | 29.57 | 29.57 | 29.57 | 29.57 | 29.57 |
| EBITAT | 25.4 | 42.4 | 45.0 | 41.3 | 49.8 | 50.4 | 54.3 | 58.6 | 63.2 | 68.2 |
| Depreciation | ||||||||||
| Changes in Account Receivables | ||||||||||
| Changes in Inventories | ||||||||||
| Changes in Accounts Payable | ||||||||||
| Capital Expenditure | ||||||||||
| UFCF | -99.9 | 60.1 | 38.1 | 52.5 | 41.7 | 67.4 | 61.7 | 66.6 | 71.8 | 77.5 |
| WACC, % | 7.66 | 7.68 | 7.67 | 7.67 | 7.66 | 7.67 | 7.67 | 7.67 | 7.67 | 7.67 |
| PV UFCF | ||||||||||
| SUM PV UFCF | 276.1 | |||||||||
| Long Term Growth Rate, % | 2.00 | |||||||||
| Free cash flow (T + 1) | 79 | |||||||||
| Terminal Value | 1,394 | |||||||||
| Present Terminal Value | 964 | |||||||||
| Enterprise Value | 1,240 | |||||||||
| Net Debt | 77 | |||||||||
| Equity Value | 1,163 | |||||||||
| Diluted Shares Outstanding, MM | 7 | |||||||||
| Equity Value Per Share | 168.37 |
What You Will Get
- Pre-Filled Financial Model: CRA International, Inc.'s (CRAI) actual data provides accurate DCF valuation.
- Full Forecast Control: Modify revenue growth, profit margins, WACC, and other essential factors.
- Instant Calculations: Real-time updates allow you to view results as you make adjustments.
- Investor-Ready Template: A polished Excel file crafted for high-quality valuation presentations.
- Customizable and Reusable: Designed for adaptability, enabling repeated application for comprehensive forecasts.
Key Features
- 🔍 Real-Life CRAI Financials: Pre-filled historical and projected data for CRA International, Inc. (CRAI).
- ✏️ Fully Customizable Inputs: Adjust all critical parameters (yellow cells) like WACC, growth %, and tax rates.
- 📊 Professional DCF Valuation: Built-in formulas calculate CRA International’s intrinsic value using the Discounted Cash Flow method.
- ⚡ Instant Results: Visualize CRA International’s valuation instantly after making changes.
- Scenario Analysis: Test and compare outcomes for various financial assumptions side-by-side.
How It Works
- Step 1: Download the Excel file.
- Step 2: Review CRA International, Inc.'s (CRAI) pre-filled financial data and forecasts.
- Step 3: Modify critical inputs such as revenue growth, WACC, and tax rates (highlighted cells).
- Step 4: Watch the DCF model update instantly as you adjust your assumptions.
- Step 5: Analyze the outputs and utilize the results for your investment decisions.
Why Choose CRA International, Inc. (CRAI)?
- Expert Insights: Benefit from in-depth analysis and research from industry specialists.
- Proven Track Record: CRAI has a history of delivering reliable and impactful solutions.
- Tailored Solutions: Customize our services to meet your specific business needs and goals.
- Data-Driven Decisions: Leverage comprehensive data to enhance your strategic planning.
- Respected by Leaders: Trusted by Fortune 500 companies for our commitment to excellence.
Who Should Use CRA International, Inc. (CRAI)?
- Individual Investors: Gain insights to make informed decisions regarding investments in CRA International, Inc. (CRAI).
- Financial Analysts: Enhance analysis with comprehensive data and models specific to CRA International, Inc. (CRAI).
- Consultants: Provide clients with expert evaluations and strategic recommendations based on CRA International, Inc. (CRAI).
- Business Owners: Learn from the valuation practices of CRA International, Inc. (CRAI) to inform your own business strategies.
- Finance Students: Explore real-world applications of valuation techniques using data from CRA International, Inc. (CRAI).
What the Template Contains
- Preloaded CRAI Data: Historical and projected financial data, including revenue, EBIT, and capital expenditures.
- DCF and WACC Models: Professional-grade sheets for calculating intrinsic value and Weighted Average Cost of Capital.
- Editable Inputs: Yellow-highlighted cells for adjusting revenue growth, tax rates, and discount rates.
- Financial Statements: Comprehensive annual and quarterly financials for deeper analysis.
- Key Ratios: Profitability, leverage, and efficiency ratios to evaluate performance.
- Dashboard and Charts: Visual summaries of valuation outcomes and assumptions.
Disclaimer
All information, articles, and product details provided on this website are for general informational and educational purposes only. We do not claim any ownership over, nor do we intend to infringe upon, any trademarks, copyrights, logos, brand names, or other intellectual property mentioned or depicted on this site. Such intellectual property remains the property of its respective owners, and any references here are made solely for identification or informational purposes, without implying any affiliation, endorsement, or partnership.
We make no representations or warranties, express or implied, regarding the accuracy, completeness, or suitability of any content or products presented. Nothing on this website should be construed as legal, tax, investment, financial, medical, or other professional advice. In addition, no part of this site—including articles or product references—constitutes a solicitation, recommendation, endorsement, advertisement, or offer to buy or sell any securities, franchises, or other financial instruments, particularly in jurisdictions where such activity would be unlawful.
All content is of a general nature and may not address the specific circumstances of any individual or entity. It is not a substitute for professional advice or services. Any actions you take based on the information provided here are strictly at your own risk. You accept full responsibility for any decisions or outcomes arising from your use of this website and agree to release us from any liability in connection with your use of, or reliance upon, the content or products found herein.