
|
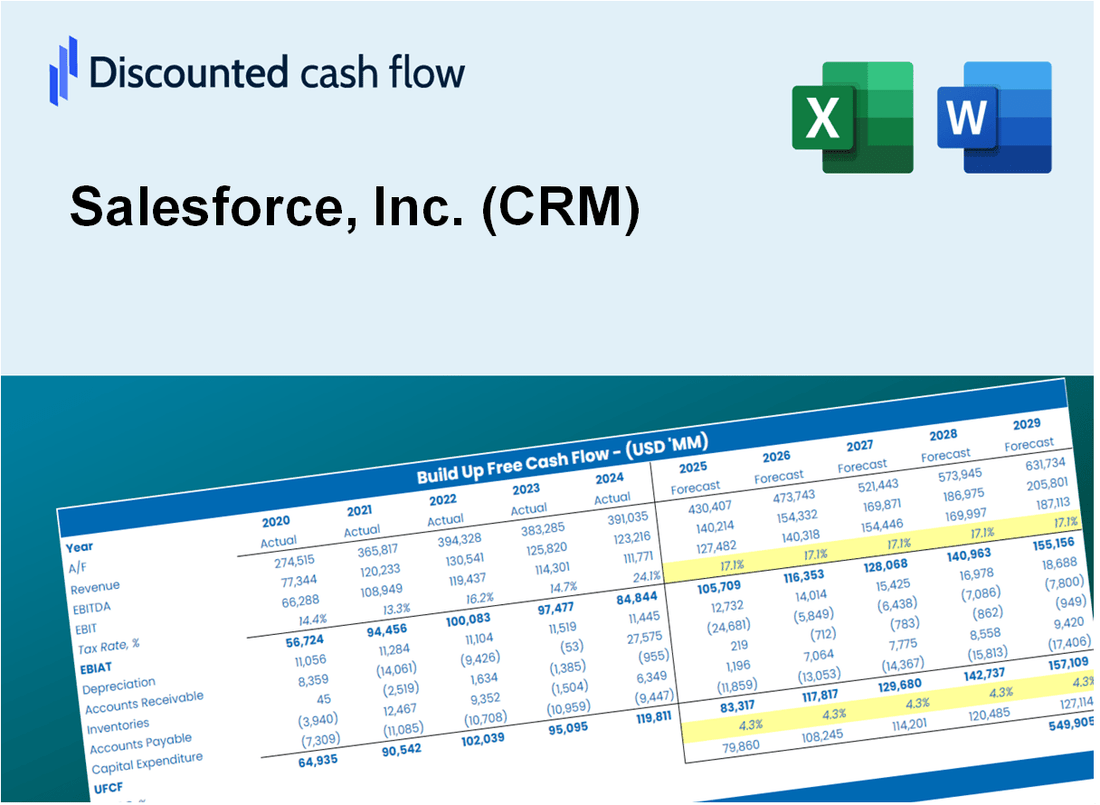
Salesforce, Inc. (CRM) DCF -Bewertung |
Fully Editable: Tailor To Your Needs In Excel Or Sheets
Professional Design: Trusted, Industry-Standard Templates
Investor-Approved Valuation Models
MAC/PC Compatible, Fully Unlocked
No Expertise Is Needed; Easy To Follow
Salesforce, Inc. (CRM) Bundle
Als Anleger oder Analyst ist der DCF-Taschenrechner Salesforce, Inc. (CRM) Ihre Anlaufstelle für eine genaue Bewertung. Mit echten Daten aus Salesforce geladen, können Sie problemlos Prognosen anpassen und die Auswirkungen sofort beobachten.
Discounted Cash Flow (DCF) - (USD MM)
| Year | AY1 2021 |
AY2 2022 |
AY3 2023 |
AY4 2024 |
AY5 2025 |
FY1 2026 |
FY2 2027 |
FY3 2028 |
FY4 2029 |
FY5 2030 |
|---|---|---|---|---|---|---|---|---|---|---|
| Revenue | 21,252.0 | 26,492.0 | 31,352.0 | 34,857.0 | 37,895.0 | 43,853.7 | 50,749.3 | 58,729.2 | 67,963.9 | 78,650.7 |
| Revenue Growth, % | 0 | 24.66 | 18.35 | 11.18 | 8.72 | 15.72 | 15.72 | 15.72 | 15.72 | 15.72 |
| EBITDA | 3,301.0 | 3,846.0 | 5,644.0 | 9,221.0 | 11,143.0 | 9,113.8 | 10,546.8 | 12,205.2 | 14,124.4 | 16,345.4 |
| EBITDA, % | 15.53 | 14.52 | 18 | 26.45 | 29.4 | 20.78 | 20.78 | 20.78 | 20.78 | 20.78 |
| Depreciation | 2,846.0 | 3,298.0 | 3,786.0 | 3,222.0 | 3,477.0 | 4,941.0 | 5,718.0 | 6,617.1 | 7,657.5 | 8,861.6 |
| Depreciation, % | 13.39 | 12.45 | 12.08 | 9.24 | 9.18 | 11.27 | 11.27 | 11.27 | 11.27 | 11.27 |
| EBIT | 455.0 | 548.0 | 1,858.0 | 5,999.0 | 7,666.0 | 4,172.7 | 4,828.9 | 5,588.2 | 6,466.9 | 7,483.7 |
| EBIT, % | 2.14 | 2.07 | 5.93 | 17.21 | 20.23 | 9.52 | 9.52 | 9.52 | 9.52 | 9.52 |
| Total Cash | 11,966.0 | 10,537.0 | 12,508.0 | 14,194.0 | 14,032.0 | 18,745.2 | 21,692.7 | 25,103.7 | 29,051.1 | 33,619.1 |
| Total Cash, percent | .0 | .0 | .0 | .0 | .0 | .0 | .0 | .0 | .0 | .0 |
| Account Receivables | 7,786.0 | 9,739.0 | 10,755.0 | 11,414.0 | 11,945.0 | 15,083.0 | 17,454.6 | 20,199.2 | 23,375.4 | 27,051.0 |
| Account Receivables, % | 36.64 | 36.76 | 34.3 | 32.75 | 31.52 | 34.39 | 34.39 | 34.39 | 34.39 | 34.39 |
| Inventories | .0 | .0 | .0 | .0 | .0 | .0 | .0 | .0 | .0 | .0 |
| Inventories, % | 0 | 0 | 0 | 0 | 0 | 0 | 0 | 0 | 0 | 0 |
| Accounts Payable | 4,355.0 | .0 | .0 | .0 | 3,521.0 | 2,612.2 | 3,023.0 | 3,498.3 | 4,048.4 | 4,685.0 |
| Accounts Payable, % | 20.49 | 0 | 0 | 0 | 9.29 | 5.96 | 5.96 | 5.96 | 5.96 | 5.96 |
| Capital Expenditure | -710.0 | -717.0 | -798.0 | -736.0 | -658.0 | -1,091.1 | -1,262.7 | -1,461.2 | -1,691.0 | -1,956.9 |
| Capital Expenditure, % | -3.34 | -2.71 | -2.55 | -2.11 | -1.74 | -2.49 | -2.49 | -2.49 | -2.49 | -2.49 |
| Tax Rate, % | 16.68 | 16.68 | 16.68 | 16.68 | 16.68 | 16.68 | 16.68 | 16.68 | 16.68 | 16.68 |
| EBITAT | 723.5 | 516.5 | 585.6 | 5,012.5 | 6,387.0 | 3,276.8 | 3,792.0 | 4,388.3 | 5,078.3 | 5,876.8 |
| Depreciation | ||||||||||
| Changes in Account Receivables | ||||||||||
| Changes in Inventories | ||||||||||
| Changes in Accounts Payable | ||||||||||
| Capital Expenditure | ||||||||||
| UFCF | -571.5 | -3,210.5 | 2,557.6 | 6,839.5 | 12,196.0 | 3,080.0 | 6,286.4 | 7,274.9 | 8,418.8 | 9,742.6 |
| WACC, % | 9.32 | 9.31 | 9.2 | 9.29 | 9.29 | 9.28 | 9.28 | 9.28 | 9.28 | 9.28 |
| PV UFCF | ||||||||||
| SUM PV UFCF | 25,808.2 | |||||||||
| Long Term Growth Rate, % | 2.00 | |||||||||
| Free cash flow (T + 1) | 9,937 | |||||||||
| Terminal Value | 136,425 | |||||||||
| Present Terminal Value | 87,520 | |||||||||
| Enterprise Value | 113,328 | |||||||||
| Net Debt | 3,222 | |||||||||
| Equity Value | 110,106 | |||||||||
| Diluted Shares Outstanding, MM | 974 | |||||||||
| Equity Value Per Share | 113.05 |
What You Will Get
- Real CRM Financials: Access to historical and projected data for precise valuation.
- Customizable Inputs: Adjust WACC, tax rates, revenue growth, and capital expenditures as needed.
- Dynamic Calculations: Intrinsic value and NPV are computed in real-time.
- Scenario Analysis: Evaluate various scenarios to assess Salesforce’s future performance.
- User-Friendly Design: Designed for professionals while remaining accessible to newcomers.
Key Features
- 🔍 Real-Life CRM Financials: Pre-filled historical and projected data for Salesforce, Inc. (CRM).
- ✏️ Fully Customizable Inputs: Adjust all critical parameters (yellow cells) like WACC, growth %, and tax rates.
- 📊 Professional DCF Valuation: Built-in formulas calculate Salesforce’s intrinsic value using the Discounted Cash Flow method.
- ⚡ Instant Results: Visualize Salesforce’s valuation instantly after making changes.
- Scenario Analysis: Test and compare outcomes for various financial assumptions side-by-side.
How It Works
- 1. Access the Template: Download and open the Excel file containing Salesforce's preloaded data.
- 2. Modify Assumptions: Adjust key inputs such as growth rates, WACC, and capital expenditures.
- 3. View Results Instantly: The DCF model automatically calculates intrinsic value and NPV.
- 4. Explore Scenarios: Analyze multiple forecasts to evaluate different valuation outcomes.
- 5. Present with Assurance: Deliver professional valuation insights to inform your decisions.
Why Choose Salesforce, Inc. (CRM)?
- Streamlined Processes: Effortlessly manage customer relationships with our intuitive platform.
- Enhanced Insights: Utilize powerful analytics to drive informed decision-making.
- Highly Adaptable: Customize solutions to meet the unique needs of your business.
- User-Friendly Interface: Navigate easily through a clean and organized dashboard.
- Industry Leader: Trusted by thousands of organizations for its reliability and performance.
Who Should Use This Product?
- Investors: Accurately estimate Salesforce’s fair value before making investment decisions.
- CFOs: Utilize a professional-grade DCF model for financial reporting and analysis.
- Consultants: Easily customize the template for valuation reports tailored to clients.
- Entrepreneurs: Gain insights into financial modeling practices employed by leading tech companies.
- Educators: Implement it as a teaching resource to illustrate valuation methodologies.
What the Template Contains
- Comprehensive DCF Model: Editable template featuring in-depth valuation calculations.
- Real-World Data: Salesforce’s historical and projected financials preloaded for analysis.
- Customizable Parameters: Modify WACC, growth rates, and tax assumptions to explore different scenarios.
- Financial Statements: Complete annual and quarterly breakdowns for enhanced insights.
- Key Ratios: Integrated analysis for profitability, efficiency, and leverage metrics.
- Dashboard with Visual Outputs: Visualizations and tables for clear, actionable insights.
Disclaimer
All information, articles, and product details provided on this website are for general informational and educational purposes only. We do not claim any ownership over, nor do we intend to infringe upon, any trademarks, copyrights, logos, brand names, or other intellectual property mentioned or depicted on this site. Such intellectual property remains the property of its respective owners, and any references here are made solely for identification or informational purposes, without implying any affiliation, endorsement, or partnership.
We make no representations or warranties, express or implied, regarding the accuracy, completeness, or suitability of any content or products presented. Nothing on this website should be construed as legal, tax, investment, financial, medical, or other professional advice. In addition, no part of this site—including articles or product references—constitutes a solicitation, recommendation, endorsement, advertisement, or offer to buy or sell any securities, franchises, or other financial instruments, particularly in jurisdictions where such activity would be unlawful.
All content is of a general nature and may not address the specific circumstances of any individual or entity. It is not a substitute for professional advice or services. Any actions you take based on the information provided here are strictly at your own risk. You accept full responsibility for any decisions or outcomes arising from your use of this website and agree to release us from any liability in connection with your use of, or reliance upon, the content or products found herein.