
|
Ceragon Networks Ltd. (CRNT) DCF -Bewertung |
Fully Editable: Tailor To Your Needs In Excel Or Sheets
Professional Design: Trusted, Industry-Standard Templates
Investor-Approved Valuation Models
MAC/PC Compatible, Fully Unlocked
No Expertise Is Needed; Easy To Follow
Ceragon Networks Ltd. (CRNT) Bundle
Entdecken Sie das wahre Potenzial von Ceragon Networks Ltd. (CRNT) mit unserem erweiterten DCF -Taschenrechner! Passen Sie die entscheidenden Annahmen an, erkunden Sie verschiedene Szenarien und bewerten Sie, wie sich diese Änderungen auf die Bewertung des Ceragon auswirken - alles innerhalb einer umfassenden Excel -Vorlage.
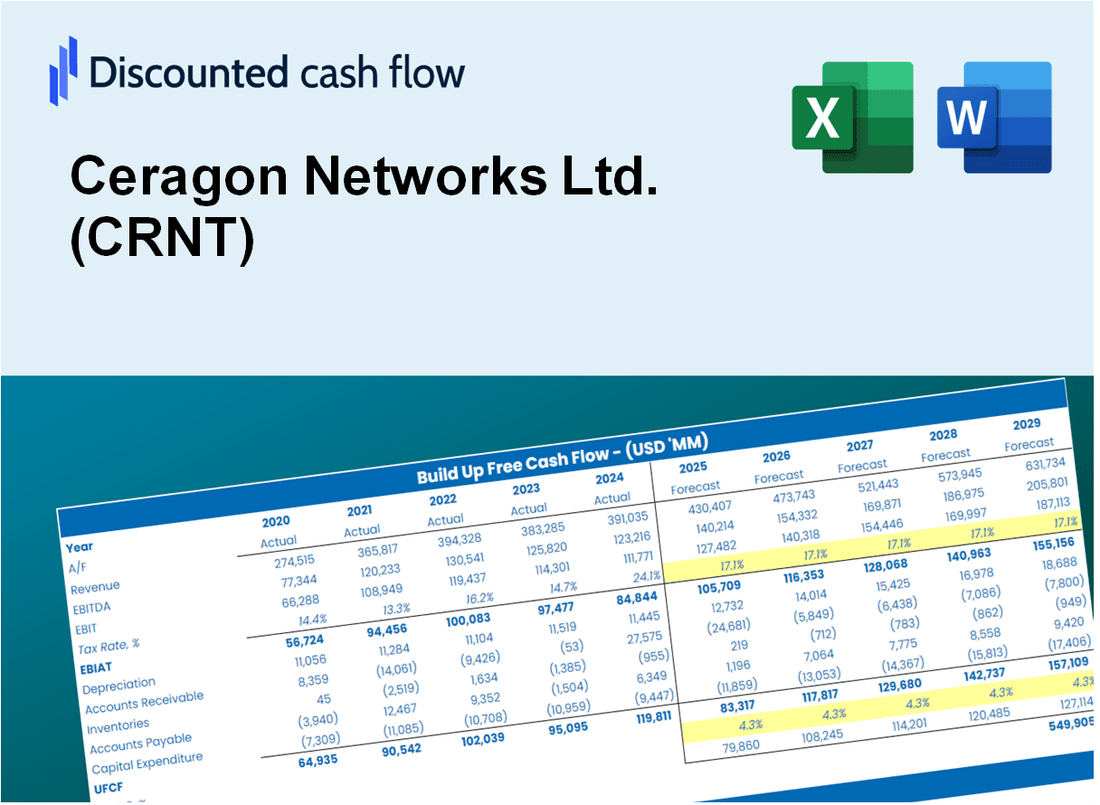
Discounted Cash Flow (DCF) - (USD MM)
| Year | AY1 2020 |
AY2 2021 |
AY3 2022 |
AY4 2023 |
AY5 2024 |
FY1 2025 |
FY2 2026 |
FY3 2027 |
FY4 2028 |
FY5 2029 |
|---|---|---|---|---|---|---|---|---|---|---|
| Revenue | 262.9 | 290.8 | 295.2 | 347.2 | 394.2 | 436.8 | 484.1 | 536.5 | 594.6 | 658.9 |
| Revenue Growth, % | 0 | 10.61 | 1.52 | 17.62 | 13.54 | 10.82 | 10.82 | 10.82 | 10.82 | 10.82 |
| EBITDA | 3.5 | 13.1 | -1.2 | 30.2 | 45.3 | 22.4 | 24.8 | 27.5 | 30.5 | 33.8 |
| EBITDA, % | 1.33 | 4.5 | -0.40214 | 8.71 | 11.5 | 5.13 | 5.13 | 5.13 | 5.13 | 5.13 |
| Depreciation | 12.9 | 12.2 | 11.0 | 10.0 | 12.1 | 16.4 | 18.2 | 20.2 | 22.3 | 24.8 |
| Depreciation, % | 4.89 | 4.21 | 3.74 | 2.87 | 3.07 | 3.76 | 3.76 | 3.76 | 3.76 | 3.76 |
| EBIT | -9.4 | .8 | -12.2 | 20.3 | 33.2 | 6.0 | 6.6 | 7.4 | 8.1 | 9.0 |
| EBIT, % | -3.56 | 0.2858 | -4.14 | 5.84 | 8.43 | 1.37 | 1.37 | 1.37 | 1.37 | 1.37 |
| Total Cash | 27.1 | 17.1 | 22.9 | 28.2 | 35.3 | 35.9 | 39.7 | 44.0 | 48.8 | 54.1 |
| Total Cash, percent | .0 | .0 | .0 | .0 | .0 | .0 | .0 | .0 | .0 | .0 |
| Account Receivables | 114.2 | 117.7 | 109.3 | 113.9 | 153.1 | 168.2 | 186.5 | 206.6 | 229.0 | 253.8 |
| Account Receivables, % | 43.45 | 40.47 | 37.03 | 32.79 | 38.83 | 38.51 | 38.51 | 38.51 | 38.51 | 38.51 |
| Inventories | 50.6 | 61.4 | 72.0 | 68.8 | 59.7 | 87.1 | 96.6 | 107.0 | 118.6 | 131.4 |
| Inventories, % | 19.26 | 21.12 | 24.4 | 19.82 | 15.14 | 19.95 | 19.95 | 19.95 | 19.95 | 19.95 |
| Accounts Payable | 63.7 | 69.4 | 67.4 | 67.0 | 91.2 | 99.1 | 109.8 | 121.7 | 134.8 | 149.4 |
| Accounts Payable, % | 24.24 | 23.88 | 22.83 | 19.31 | 23.13 | 22.68 | 22.68 | 22.68 | 22.68 | 22.68 |
| Capital Expenditure | -6.1 | -9.6 | -12.4 | -12.9 | -16.5 | -15.5 | -17.1 | -19.0 | -21.1 | -23.3 |
| Capital Expenditure, % | -2.31 | -3.3 | -4.21 | -3.72 | -4.18 | -3.54 | -3.54 | -3.54 | -3.54 | -3.54 |
| Tax Rate, % | 11.71 | 11.71 | 11.71 | 11.71 | 11.71 | 11.71 | 11.71 | 11.71 | 11.71 | 11.71 |
| EBITAT | -11.1 | 3.2 | -14.0 | 9.9 | 29.3 | 5.2 | 5.8 | 6.4 | 7.1 | 7.9 |
| Depreciation | ||||||||||
| Changes in Account Receivables | ||||||||||
| Changes in Inventories | ||||||||||
| Changes in Accounts Payable | ||||||||||
| Capital Expenditure | ||||||||||
| UFCF | -105.4 | -2.6 | -19.6 | 5.3 | 19.0 | -28.6 | -10.1 | -11.2 | -12.4 | -13.7 |
| WACC, % | 9.77 | 9.77 | 9.77 | 8.41 | 9.46 | 9.44 | 9.44 | 9.44 | 9.44 | 9.44 |
| PV UFCF | ||||||||||
| SUM PV UFCF | -60.4 | |||||||||
| Long Term Growth Rate, % | 4.00 | |||||||||
| Free cash flow (T + 1) | -14 | |||||||||
| Terminal Value | -262 | |||||||||
| Present Terminal Value | -167 | |||||||||
| Enterprise Value | -228 | |||||||||
| Net Debt | 6 | |||||||||
| Equity Value | -233 | |||||||||
| Diluted Shares Outstanding, MM | 88 | |||||||||
| Equity Value Per Share | -2.64 |
What You Will Receive
- Pre-Configured Financial Model: Ceragon Networks Ltd. (CRNT)’s actual data facilitates accurate DCF valuation.
- Comprehensive Forecast Control: Modify revenue growth, profit margins, WACC, and other essential parameters.
- Real-Time Calculations: Automatic updates provide immediate visibility of results as adjustments are made.
- Professional-Grade Template: A polished Excel file crafted for high-quality valuation presentations.
- Flexible and Reusable: Designed for adaptability, allowing for repeated application in detailed forecasting.
Key Features
- Customizable Network Parameters: Adjust essential inputs such as bandwidth demand, service reliability, and operational costs.
- Instant DCF Valuation: Quickly computes intrinsic value, NPV, and additional metrics for informed decision-making.
- Industry-Leading Precision: Leverages Ceragon's actual financial data for accurate valuation results.
- Effortless Scenario Analysis: Easily evaluate various assumptions and analyze different outcomes.
- Efficiency Booster: Streamlines the valuation process, removing the need for intricate model development.
How It Works
- 1. Access the Template: Download and open the Excel file featuring Ceragon Networks Ltd.'s (CRNT) preloaded data.
- 2. Modify Assumptions: Adjust key inputs such as growth rates, WACC, and capital expenditures.
- 3. View Results in Real-Time: The DCF model automatically calculates intrinsic value and NPV.
- 4. Explore Scenarios: Analyze various forecasts to evaluate different valuation outcomes.
- 5. Present with Assurance: Share professional valuation insights to back your decisions.
Why Choose Ceragon Networks Ltd. (CRNT)?
- Innovative Solutions: Cutting-edge technology tailored for modern networking challenges.
- Proven Track Record: Extensive experience in delivering reliable connectivity solutions worldwide.
- Flexible Offerings: Customizable services to meet diverse customer needs and requirements.
- Expert Support: Dedicated team of professionals ready to assist and optimize your network.
- Industry Recognition: Trusted by leading companies for high-quality performance and reliability.
Who Should Use This Product?
- Professional Investors: Develop comprehensive and reliable valuation models for analyzing Ceragon Networks Ltd. (CRNT) stock.
- Corporate Finance Teams: Evaluate valuation scenarios to inform strategic decisions within the organization.
- Consultants and Advisors: Deliver precise valuation insights to clients interested in Ceragon Networks Ltd. (CRNT).
- Students and Educators: Utilize real-world data to enhance learning and practice in financial modeling.
- Tech Enthusiasts: Gain insights into how telecommunications companies like Ceragon Networks Ltd. (CRNT) are valued in the market.
What the Template Contains
- Operating and Balance Sheet Data: Pre-filled Ceragon Networks Ltd. (CRNT) historical data and forecasts, including revenue, EBITDA, EBIT, and capital expenditures.
- WACC Calculation: A dedicated sheet for Weighted Average Cost of Capital (WACC), including parameters like Beta, risk-free rate, and share price.
- DCF Valuation (Unlevered and Levered): Editable Discounted Cash Flow models showing intrinsic value with detailed calculations.
- Financial Statements: Pre-loaded financial statements (annual and quarterly) to support analysis.
- Key Ratios: Includes profitability, leverage, and efficiency ratios for Ceragon Networks Ltd. (CRNT).
- Dashboard and Charts: Visual summary of valuation outputs and assumptions to analyze results easily.
Disclaimer
All information, articles, and product details provided on this website are for general informational and educational purposes only. We do not claim any ownership over, nor do we intend to infringe upon, any trademarks, copyrights, logos, brand names, or other intellectual property mentioned or depicted on this site. Such intellectual property remains the property of its respective owners, and any references here are made solely for identification or informational purposes, without implying any affiliation, endorsement, or partnership.
We make no representations or warranties, express or implied, regarding the accuracy, completeness, or suitability of any content or products presented. Nothing on this website should be construed as legal, tax, investment, financial, medical, or other professional advice. In addition, no part of this site—including articles or product references—constitutes a solicitation, recommendation, endorsement, advertisement, or offer to buy or sell any securities, franchises, or other financial instruments, particularly in jurisdictions where such activity would be unlawful.
All content is of a general nature and may not address the specific circumstances of any individual or entity. It is not a substitute for professional advice or services. Any actions you take based on the information provided here are strictly at your own risk. You accept full responsibility for any decisions or outcomes arising from your use of this website and agree to release us from any liability in connection with your use of, or reliance upon, the content or products found herein.