
|
Cronos Group Inc. (Cron) DCF -Bewertung |
Fully Editable: Tailor To Your Needs In Excel Or Sheets
Professional Design: Trusted, Industry-Standard Templates
Investor-Approved Valuation Models
MAC/PC Compatible, Fully Unlocked
No Expertise Is Needed; Easy To Follow
Cronos Group Inc. (CRON) Bundle
Vereinfachen Sie die Bewertung der Cronos Group Inc. (CRON) mit diesem anpassbaren DCF -Taschenrechner! Mit Real Cronos Group Inc. (CRON) Financials und einstellbaren Prognoseeingaben können Sie Szenarien testen und die Fair -Wert der Cronos Group Inc. (CRON) in Minuten aufdecken.
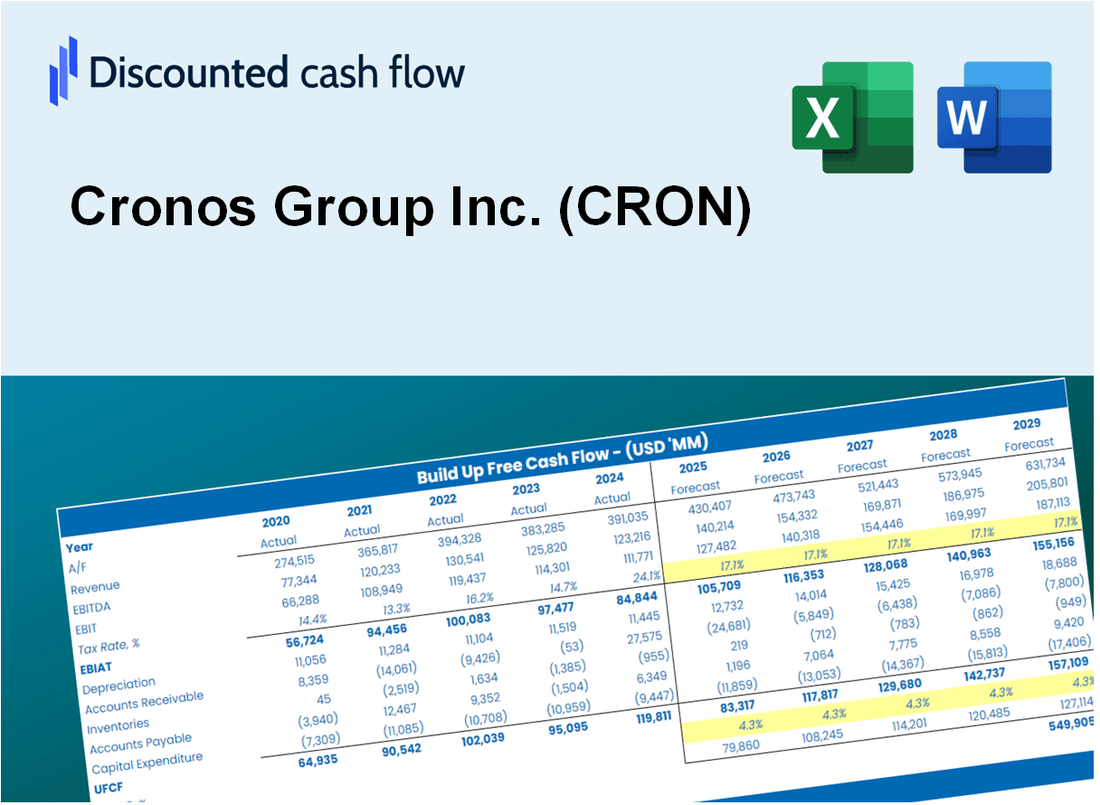
Discounted Cash Flow (DCF) - (USD MM)
| Year | AY1 2020 |
AY2 2021 |
AY3 2022 |
AY4 2023 |
AY5 2024 |
FY1 2025 |
FY2 2026 |
FY3 2027 |
FY4 2028 |
FY5 2029 |
|---|---|---|---|---|---|---|---|---|---|---|
| Revenue | 33.3 | 46.0 | 61.8 | 62.2 | 83.8 | 106.4 | 135.1 | 171.6 | 217.9 | 276.7 |
| Revenue Growth, % | 0 | 38.19 | 34.37 | 0.56715 | 34.82 | 26.99 | 26.99 | 26.99 | 26.99 | 26.99 |
| EBITDA | -47.1 | -107.0 | -65.0 | -51.2 | -35.8 | -90.5 | -114.9 | -145.9 | -185.2 | -235.2 |
| EBITDA, % | -141.36 | -232.53 | -105.21 | -82.3 | -42.69 | -85 | -85 | -85 | -85 | -85 |
| Depreciation | 5.0 | 11.0 | 9.4 | 5.8 | 6.7 | 15.2 | 19.3 | 24.5 | 31.1 | 39.5 |
| Depreciation, % | 15.08 | 23.86 | 15.13 | 9.3 | 7.94 | 14.26 | 14.26 | 14.26 | 14.26 | 14.26 |
| EBIT | -52.1 | -117.9 | -74.4 | -56.9 | -42.4 | -94.1 | -119.5 | -151.8 | -192.7 | -244.7 |
| EBIT, % | -156.44 | -256.39 | -120.34 | -91.6 | -50.63 | -88.45 | -88.45 | -88.45 | -88.45 | -88.45 |
| Total Cash | 919.0 | 715.9 | 625.4 | 613.9 | 611.9 | 106.4 | 135.1 | 171.6 | 217.9 | 276.7 |
| Total Cash, percent | .0 | .0 | .0 | .0 | .0 | .0 | .0 | .0 | .0 | .0 |
| Account Receivables | 18.6 | 23.7 | 22.3 | 25.6 | 21.2 | 44.7 | 56.7 | 72.0 | 91.4 | 116.1 |
| Account Receivables, % | 55.75 | 51.57 | 36.07 | 41.13 | 25.31 | 41.96 | 41.96 | 41.96 | 41.96 | 41.96 |
| Inventories | 31.4 | 23.4 | 26.8 | 21.7 | 23.6 | 53.5 | 68.0 | 86.3 | 109.6 | 139.2 |
| Inventories, % | 94.18 | 50.81 | 43.3 | 34.95 | 28.18 | 50.29 | 50.29 | 50.29 | 50.29 | 50.29 |
| Accounts Payable | 13.8 | 7.9 | 8.0 | 8.6 | 12.1 | 21.2 | 27.0 | 34.3 | 43.5 | 55.2 |
| Accounts Payable, % | 41.41 | 17.21 | 12.87 | 13.9 | 14.43 | 19.97 | 19.97 | 19.97 | 19.97 | 19.97 |
| Capital Expenditure | -25.2 | -8.7 | -3.6 | -2.4 | -9.4 | -24.6 | -31.3 | -39.7 | -50.4 | -64.0 |
| Capital Expenditure, % | -75.75 | -18.99 | -5.8 | -3.92 | -11.18 | -23.13 | -23.13 | -23.13 | -23.13 | -23.13 |
| Tax Rate, % | -12.28 | -12.28 | -12.28 | -12.28 | -12.28 | -12.28 | -12.28 | -12.28 | -12.28 | -12.28 |
| EBITAT | -52.0 | -363.5 | -103.7 | -57.2 | -47.6 | -94.1 | -119.5 | -151.7 | -192.7 | -244.7 |
| Depreciation | ||||||||||
| Changes in Account Receivables | ||||||||||
| Changes in Inventories | ||||||||||
| Changes in Accounts Payable | ||||||||||
| Capital Expenditure | ||||||||||
| UFCF | -108.3 | -364.4 | -99.9 | -51.4 | -44.5 | -147.7 | -152.2 | -193.3 | -245.5 | -311.7 |
| WACC, % | 8.75 | 8.75 | 8.75 | 8.75 | 8.75 | 8.75 | 8.75 | 8.75 | 8.75 | 8.75 |
| PV UFCF | ||||||||||
| SUM PV UFCF | -795.3 | |||||||||
| Long Term Growth Rate, % | 2.00 | |||||||||
| Free cash flow (T + 1) | -318 | |||||||||
| Terminal Value | -4,711 | |||||||||
| Present Terminal Value | -3,097 | |||||||||
| Enterprise Value | -3,892 | |||||||||
| Net Debt | -611 | |||||||||
| Equity Value | -3,282 | |||||||||
| Diluted Shares Outstanding, MM | 386 | |||||||||
| Equity Value Per Share | -8.51 |
What You Will Get
- Real CRON Financials: Access to historical and projected data for precise valuation.
- Customizable Inputs: Adjust WACC, tax rates, revenue growth, and capital expenditures to fit your analysis.
- Dynamic Calculations: Intrinsic value and NPV are automatically computed in real-time.
- Scenario Analysis: Evaluate various scenarios to assess Cronos Group's future performance.
- User-Friendly Design: Designed for professionals while remaining approachable for newcomers.
Key Features
- Comprehensive Data: Cronos Group Inc.'s (CRON) historical financial records and pre-filled projections.
- Customizable Inputs: Modify WACC, tax rates, revenue growth, and EBITDA margins as needed.
- Real-Time Insights: View Cronos Group Inc.'s (CRON) intrinsic value update instantly.
- Intuitive Visualizations: Dashboard graphs present valuation outcomes and essential metrics clearly.
- Designed for Precision: A sophisticated tool tailored for analysts, investors, and finance professionals.
How It Works
- 1. Access the Template: Download and open the Excel file containing Cronos Group Inc.'s preloaded data.
- 2. Adjust Assumptions: Modify key inputs such as growth rates, WACC, and capital expenditures.
- 3. View Results Instantly: The DCF model automatically computes intrinsic value and NPV.
- 4. Explore Scenarios: Analyze various forecasts to evaluate different valuation results.
- 5. Present with Assurance: Deliver professional valuation insights to back your decisions.
Why Choose This Calculator for Cronos Group Inc. (CRON)?
- Accuracy: Utilizes real Cronos Group financials to ensure precise data.
- Flexibility: Allows users to easily test and adjust inputs as needed.
- Time-Saving: Eliminate the need to construct a DCF model from the ground up.
- Professional-Grade: Crafted with the precision and usability expected at the CFO level.
- User-Friendly: Designed for ease of use, suitable for those without extensive financial modeling expertise.
Who Should Use Cronos Group Inc. (CRON)?
- Investors: Enhance your portfolio decisions with insights from a leading cannabis company.
- Financial Analysts: Utilize comprehensive market data to inform your analysis on CRON's performance.
- Consultants: Tailor your recommendations using Cronos Group's innovative product offerings.
- Cannabis Enthusiasts: Gain a deeper understanding of the cannabis market dynamics through CRON's strategies.
- Educators and Students: Explore real-world applications of business concepts in the rapidly evolving cannabis industry.
What the Template Contains
- Operating and Balance Sheet Data: Pre-filled Cronos Group Inc. historical data and forecasts, including revenue, EBITDA, EBIT, and capital expenditures.
- WACC Calculation: A dedicated sheet for Weighted Average Cost of Capital (WACC), including parameters like Beta, risk-free rate, and share price.
- DCF Valuation (Unlevered and Levered): Editable Discounted Cash Flow models showing intrinsic value with detailed calculations.
- Financial Statements: Pre-loaded financial statements (annual and quarterly) to support analysis.
- Key Ratios: Includes profitability, leverage, and efficiency ratios for Cronos Group Inc. (CRON).
- Dashboard and Charts: Visual summary of valuation outputs and assumptions to analyze results easily.
Disclaimer
All information, articles, and product details provided on this website are for general informational and educational purposes only. We do not claim any ownership over, nor do we intend to infringe upon, any trademarks, copyrights, logos, brand names, or other intellectual property mentioned or depicted on this site. Such intellectual property remains the property of its respective owners, and any references here are made solely for identification or informational purposes, without implying any affiliation, endorsement, or partnership.
We make no representations or warranties, express or implied, regarding the accuracy, completeness, or suitability of any content or products presented. Nothing on this website should be construed as legal, tax, investment, financial, medical, or other professional advice. In addition, no part of this site—including articles or product references—constitutes a solicitation, recommendation, endorsement, advertisement, or offer to buy or sell any securities, franchises, or other financial instruments, particularly in jurisdictions where such activity would be unlawful.
All content is of a general nature and may not address the specific circumstances of any individual or entity. It is not a substitute for professional advice or services. Any actions you take based on the information provided here are strictly at your own risk. You accept full responsibility for any decisions or outcomes arising from your use of this website and agree to release us from any liability in connection with your use of, or reliance upon, the content or products found herein.