
|
CuriosityStream Inc. (CURI) DCF -Bewertung |
Fully Editable: Tailor To Your Needs In Excel Or Sheets
Professional Design: Trusted, Industry-Standard Templates
Investor-Approved Valuation Models
MAC/PC Compatible, Fully Unlocked
No Expertise Is Needed; Easy To Follow
CuriosityStream Inc. (CURI) Bundle
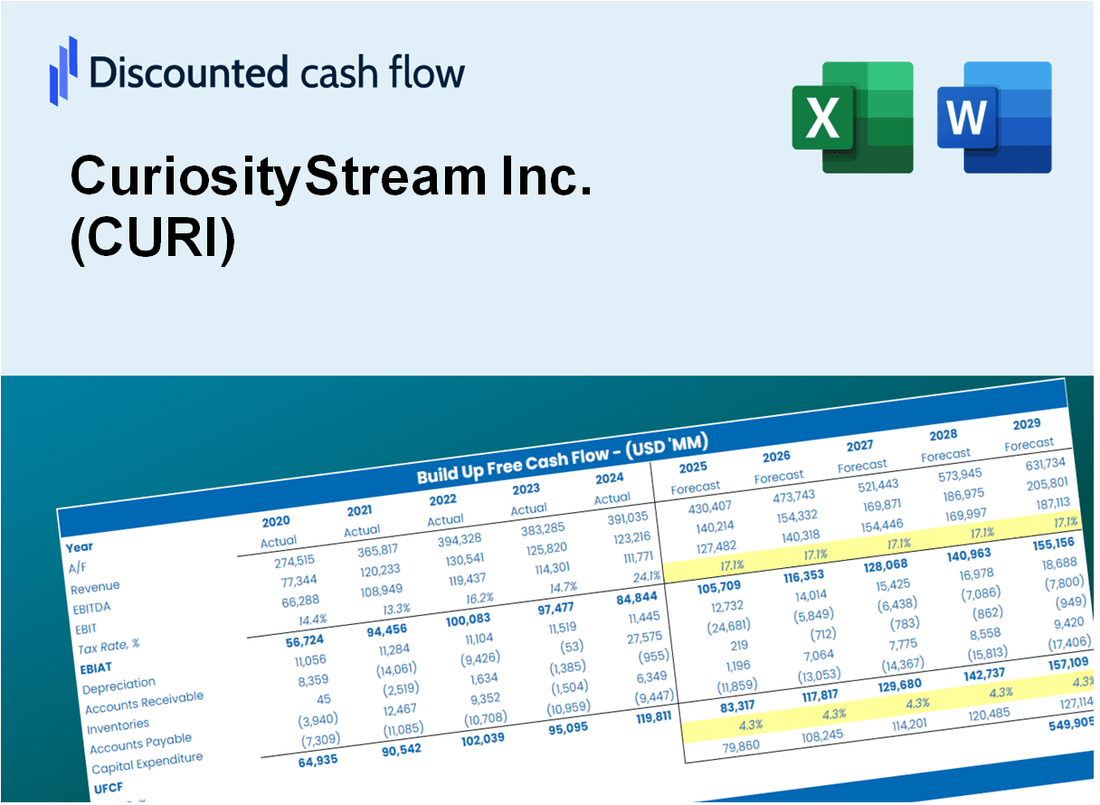
Nutzen Sie die Kraft der CuriosityStream Inc. (CURI) -Schanganalyse mit unserem ausgefeilten DCF -Taschenrechner! Diese Excel -Vorlage wird mit tatsächlichen (CURI) -Daten vorinstalliert, sodass Sie die Prognosen und Annahmen anpassen können, um den intrinsischen Wert von CuriosityStream Inc. mit Genauigkeit zu berechnen.
Discounted Cash Flow (DCF) - (USD MM)
| Year | AY1 2020 |
AY2 2021 |
AY3 2022 |
AY4 2023 |
AY5 2024 |
FY1 2025 |
FY2 2026 |
FY3 2027 |
FY4 2028 |
FY5 2029 |
|---|---|---|---|---|---|---|---|---|---|---|
| Revenue | 39.6 | 71.3 | 78.0 | 56.9 | 51.1 | 57.8 | 65.3 | 73.9 | 83.5 | 94.4 |
| Revenue Growth, % | 0 | 79.86 | 9.52 | -27.11 | -10.12 | 13.04 | 13.04 | 13.04 | 13.04 | 13.04 |
| EBITDA | -28.7 | -24.0 | -11.7 | -2.1 | 6.1 | -13.0 | -14.7 | -16.7 | -18.8 | -21.3 |
| EBITDA, % | -72.47 | -33.66 | -14.98 | -3.69 | 12 | -22.56 | -22.56 | -22.56 | -22.56 | -22.56 |
| Depreciation | 10.1 | 28.5 | 40.0 | 23.4 | 19.5 | 22.6 | 25.6 | 28.9 | 32.7 | 37.0 |
| Depreciation, % | 25.46 | 39.98 | 51.24 | 41.13 | 38.07 | 39.18 | 39.18 | 39.18 | 39.18 | 39.18 |
| EBIT | -38.8 | -52.5 | -51.7 | -25.5 | -13.3 | -35.7 | -40.3 | -45.6 | -51.5 | -58.3 |
| EBIT, % | -97.93 | -73.64 | -66.22 | -44.83 | -26.07 | -61.74 | -61.74 | -61.74 | -61.74 | -61.74 |
| Total Cash | 33.4 | 81.0 | 55.0 | 37.7 | 32.1 | 44.4 | 50.1 | 56.7 | 64.1 | 72.4 |
| Total Cash, percent | .0 | .0 | .0 | .0 | .0 | .0 | .0 | .0 | .0 | .0 |
| Account Receivables | 7.2 | 23.5 | 10.9 | 4.8 | 6.1 | 9.9 | 11.2 | 12.6 | 14.3 | 16.1 |
| Account Receivables, % | 18.23 | 32.97 | 13.97 | 8.37 | 11.94 | 17.09 | 17.09 | 17.09 | 17.09 | 17.09 |
| Inventories | 6.2 | .0 | .0 | .0 | .0 | 1.8 | 2.0 | 2.3 | 2.6 | 2.9 |
| Inventories, % | 15.6 | 0 | 0 | 0 | 0 | 3.12 | 3.12 | 3.12 | 3.12 | 3.12 |
| Accounts Payable | 3.6 | 3.4 | 6.1 | 4.8 | 5.6 | 4.7 | 5.4 | 6.0 | 6.8 | 7.7 |
| Accounts Payable, % | 9.03 | 4.81 | 7.77 | 8.38 | 10.97 | 8.19 | 8.19 | 8.19 | 8.19 | 8.19 |
| Capital Expenditure | -.4 | -.4 | -.1 | .0 | .0 | -.2 | -.2 | -.2 | -.3 | -.3 |
| Capital Expenditure, % | -0.92628 | -0.49256 | -0.16657 | -0.00878905 | 0 | -0.31884 | -0.31884 | -0.31884 | -0.31884 | -0.31884 |
| Tax Rate, % | -1.03 | -1.03 | -1.03 | -1.03 | -1.03 | -1.03 | -1.03 | -1.03 | -1.03 | -1.03 |
| EBITAT | -38.9 | -53.0 | -52.1 | -25.8 | -13.5 | -35.7 | -40.3 | -45.6 | -51.5 | -58.3 |
| Depreciation | ||||||||||
| Changes in Account Receivables | ||||||||||
| Changes in Inventories | ||||||||||
| Changes in Accounts Payable | ||||||||||
| Capital Expenditure | ||||||||||
| UFCF | -39.1 | -35.1 | 3.0 | 2.5 | 5.5 | -19.7 | -15.9 | -17.9 | -20.3 | -22.9 |
| WACC, % | 12.43 | 12.43 | 12.43 | 12.43 | 12.43 | 12.43 | 12.43 | 12.43 | 12.43 | 12.43 |
| PV UFCF | ||||||||||
| SUM PV UFCF | -68.1 | |||||||||
| Long Term Growth Rate, % | 2.00 | |||||||||
| Free cash flow (T + 1) | -23 | |||||||||
| Terminal Value | -224 | |||||||||
| Present Terminal Value | -125 | |||||||||
| Enterprise Value | -193 | |||||||||
| Net Debt | -4 | |||||||||
| Equity Value | -189 | |||||||||
| Diluted Shares Outstanding, MM | 54 | |||||||||
| Equity Value Per Share | -3.47 |
What You Will Get
- Real CURI Financials: Access to historical and projected data for precise valuation.
- Customizable Inputs: Adjust WACC, tax rates, revenue growth, and capital expenditures as needed.
- Dynamic Calculations: Intrinsic value and NPV are calculated in real-time.
- Scenario Analysis: Explore various scenarios to assess CuriosityStream’s future performance.
- User-Friendly Design: Tailored for professionals while remaining easy for newcomers to navigate.
Key Features
- Customizable Subscription Metrics: Adjust essential parameters like user growth, churn rate, and average revenue per user.
- Instant Content Valuation: Provides real-time assessments of content library value, subscriber lifetime value, and other financial metrics.
- Industry-Leading Precision: Utilizes CuriosityStream's actual financial data for accurate valuation results.
- Effortless Scenario Planning: Explore various business models and forecast outcomes with ease.
- Efficiency-Boosting Solution: Streamline the valuation process without the hassle of creating complex financial models from the ground up.
How It Works
- Step 1: Download the Excel file.
- Step 2: Review CuriosityStream Inc.'s pre-filled financial data and forecasts.
- Step 3: Modify key inputs such as subscriber growth, content costs, and marketing expenses (highlighted cells).
- Step 4: Observe the DCF model update in real-time as you adjust your assumptions.
- Step 5: Evaluate the results and leverage the insights for investment decisions.
Why Choose This Calculator for CuriosityStream Inc. (CURI)?
- All-in-One Solution: Combines DCF, WACC, and financial ratio analyses tailored for CuriosityStream.
- Flexible Inputs: Modify the yellow-highlighted cells to explore different financial scenarios.
- In-Depth Analysis: Automatically computes CuriosityStream’s intrinsic value and Net Present Value.
- Preloaded Information: Historical and projected data provide reliable starting points for analysis.
- High-Quality Standards: Perfect for financial analysts, investors, and business advisors focusing on media and streaming sectors.
Who Should Use CuriosityStream Inc. (CURI)?
- Documentary Lovers: Explore a vast library of high-quality documentaries and series.
- Educators: Enhance classroom learning with engaging educational content.
- Parents: Provide children with safe and enriching viewing options.
- Curious Minds: Satisfy your thirst for knowledge across a range of topics.
- Content Creators: Use the platform for inspiration and research in your projects.
What the Template Contains
- Pre-Filled DCF Model: CuriosityStream Inc.’s (CURI) financial data preloaded for immediate use.
- WACC Calculator: Detailed calculations for Weighted Average Cost of Capital specific to CuriosityStream Inc. (CURI).
- Financial Ratios: Evaluate CuriosityStream Inc.’s (CURI) profitability, leverage, and efficiency metrics.
- Editable Inputs: Adjust assumptions such as growth, margins, and CAPEX to align with your scenarios.
- Financial Statements: Annual and quarterly reports for CuriosityStream Inc. (CURI) to support in-depth analysis.
- Interactive Dashboard: Easily visualize key valuation metrics and results for CuriosityStream Inc. (CURI).
Disclaimer
All information, articles, and product details provided on this website are for general informational and educational purposes only. We do not claim any ownership over, nor do we intend to infringe upon, any trademarks, copyrights, logos, brand names, or other intellectual property mentioned or depicted on this site. Such intellectual property remains the property of its respective owners, and any references here are made solely for identification or informational purposes, without implying any affiliation, endorsement, or partnership.
We make no representations or warranties, express or implied, regarding the accuracy, completeness, or suitability of any content or products presented. Nothing on this website should be construed as legal, tax, investment, financial, medical, or other professional advice. In addition, no part of this site—including articles or product references—constitutes a solicitation, recommendation, endorsement, advertisement, or offer to buy or sell any securities, franchises, or other financial instruments, particularly in jurisdictions where such activity would be unlawful.
All content is of a general nature and may not address the specific circumstances of any individual or entity. It is not a substitute for professional advice or services. Any actions you take based on the information provided here are strictly at your own risk. You accept full responsibility for any decisions or outcomes arising from your use of this website and agree to release us from any liability in connection with your use of, or reliance upon, the content or products found herein.