|
Cyanotech Corporation (CYAN) DCF -Bewertung |
Fully Editable: Tailor To Your Needs In Excel Or Sheets
Professional Design: Trusted, Industry-Standard Templates
Investor-Approved Valuation Models
MAC/PC Compatible, Fully Unlocked
No Expertise Is Needed; Easy To Follow
Cyanotech Corporation (CYAN) Bundle
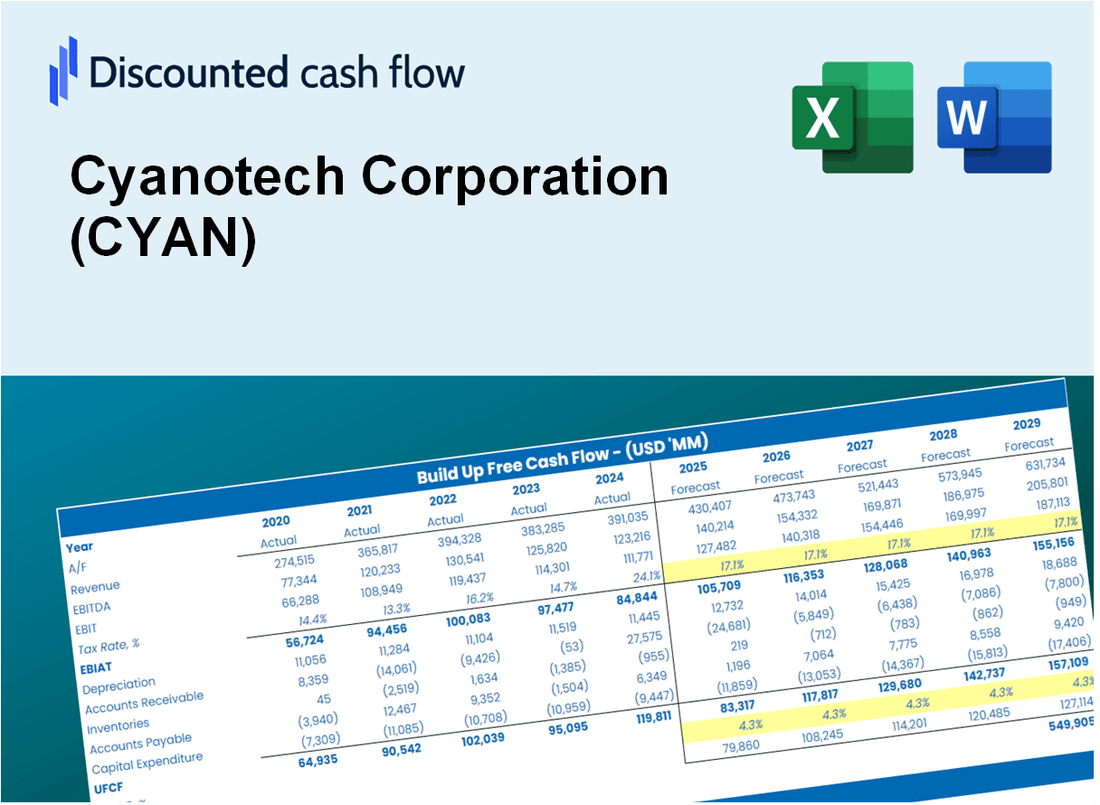
Entdecken Sie den wahren Wert der Cyanotech Corporation (Cyan) mit unserem fortschrittlichen DCF -Taschenrechner! Passen Sie kritische Annahmen an, erkunden Sie verschiedene Szenarien und untersuchen, wie sich Änderungen auf die Bewertung von Cyanotech auswirken - alles innerhalb einer bequemen Excel -Vorlage.
What You Will Get
- Real CYAN Financial Data: Pre-filled with Cyanotech Corporation’s historical and projected data for precise analysis.
- Fully Editable Template: Modify key inputs like revenue growth, WACC, and EBITDA % with ease.
- Automatic Calculations: See Cyanotech Corporation’s intrinsic value update instantly based on your changes.
- Professional Valuation Tool: Designed for investors, analysts, and consultants seeking accurate DCF results.
- User-Friendly Design: Simple structure and clear instructions for all experience levels.
Key Features
- Pre-Loaded Data: Cyanotech Corporation’s historical financial statements and pre-filled forecasts.
- Fully Adjustable Inputs: Modify WACC, tax rates, revenue growth, and EBITDA margins.
- Instant Results: View Cyanotech’s intrinsic value recalculated in real time.
- Clear Visual Outputs: Dashboard charts illustrate valuation results and key metrics.
- Built for Accuracy: A professional tool designed for analysts, investors, and finance experts.
How It Works
- 1. Access the Template: Download and open the Excel file featuring Cyanotech Corporation's (CYAN) preloaded data.
- 2. Modify Assumptions: Adjust essential inputs such as growth rates, WACC, and capital expenditures.
- 3. View Results in Real-Time: The DCF model automatically calculates intrinsic value and NPV.
- 4. Explore Scenarios: Analyze various forecasts to evaluate different valuation results.
- 5. Present with Assurance: Deliver professional valuation insights to enhance your decision-making process.
Why Choose This Calculator for Cyanotech Corporation (CYAN)?
- Tailored for Investors: A specialized tool designed for analysts, investors, and financial advisors.
- Comprehensive Data: Cyanotech’s historical and projected financials are preloaded for precise analysis.
- Flexible Scenario Analysis: Effortlessly simulate various forecasts and assumptions.
- Insightful Outputs: Automatically computes intrinsic value, NPV, and critical financial metrics.
- User-Friendly: Step-by-step guidance simplifies the entire calculation process.
Who Should Use This Product?
- Professional Investors: Develop comprehensive and accurate valuation models for assessing Cyanotech Corporation (CYAN).
- Corporate Finance Teams: Evaluate valuation scenarios to inform strategic decisions within the organization.
- Consultants and Advisors: Deliver precise valuation insights for clients interested in Cyanotech Corporation (CYAN).
- Students and Educators: Utilize real-world data to enhance learning and practice in financial modeling.
- Health and Wellness Enthusiasts: Gain insights into how companies like Cyanotech Corporation (CYAN) are valued within the health sector.
What the Template Contains
- Historical Data: Includes Cyanotech Corporation’s (CYAN) past financials and baseline forecasts.
- DCF and Levered DCF Models: Detailed templates to calculate Cyanotech Corporation’s (CYAN) intrinsic value.
- WACC Sheet: Pre-built calculations for Weighted Average Cost of Capital.
- Editable Inputs: Modify key drivers like growth rates, EBITDA %, and CAPEX assumptions.
- Quarterly and Annual Statements: A complete breakdown of Cyanotech Corporation’s (CYAN) financials.
- Interactive Dashboard: Visualize valuation results and projections dynamically.
Disclaimer
All information, articles, and product details provided on this website are for general informational and educational purposes only. We do not claim any ownership over, nor do we intend to infringe upon, any trademarks, copyrights, logos, brand names, or other intellectual property mentioned or depicted on this site. Such intellectual property remains the property of its respective owners, and any references here are made solely for identification or informational purposes, without implying any affiliation, endorsement, or partnership.
We make no representations or warranties, express or implied, regarding the accuracy, completeness, or suitability of any content or products presented. Nothing on this website should be construed as legal, tax, investment, financial, medical, or other professional advice. In addition, no part of this site—including articles or product references—constitutes a solicitation, recommendation, endorsement, advertisement, or offer to buy or sell any securities, franchises, or other financial instruments, particularly in jurisdictions where such activity would be unlawful.
All content is of a general nature and may not address the specific circumstances of any individual or entity. It is not a substitute for professional advice or services. Any actions you take based on the information provided here are strictly at your own risk. You accept full responsibility for any decisions or outcomes arising from your use of this website and agree to release us from any liability in connection with your use of, or reliance upon, the content or products found herein.