
|
Tag 1 Biopharmaceuticals, Inc. (Dawn) DCF -Bewertung |
Fully Editable: Tailor To Your Needs In Excel Or Sheets
Professional Design: Trusted, Industry-Standard Templates
Investor-Approved Valuation Models
MAC/PC Compatible, Fully Unlocked
No Expertise Is Needed; Easy To Follow
Day One Biopharmaceuticals, Inc. (DAWN) Bundle
Vereinfachen Sie den ersten Tag Biopharmaceuticals, Inc. (Dawn) Bewertung mit diesem anpassbaren DCF -Taschenrechner! Mit Real Day One Biopharmaceuticals, Inc. (Dawn) Financials und einstellbaren Prognoseeingaben können Sie Szenarien und den beizulegenden Zeitwert der ersten Tag eins Bioopharmaceuticals, Inc. (Dawn) in Minuten testen.
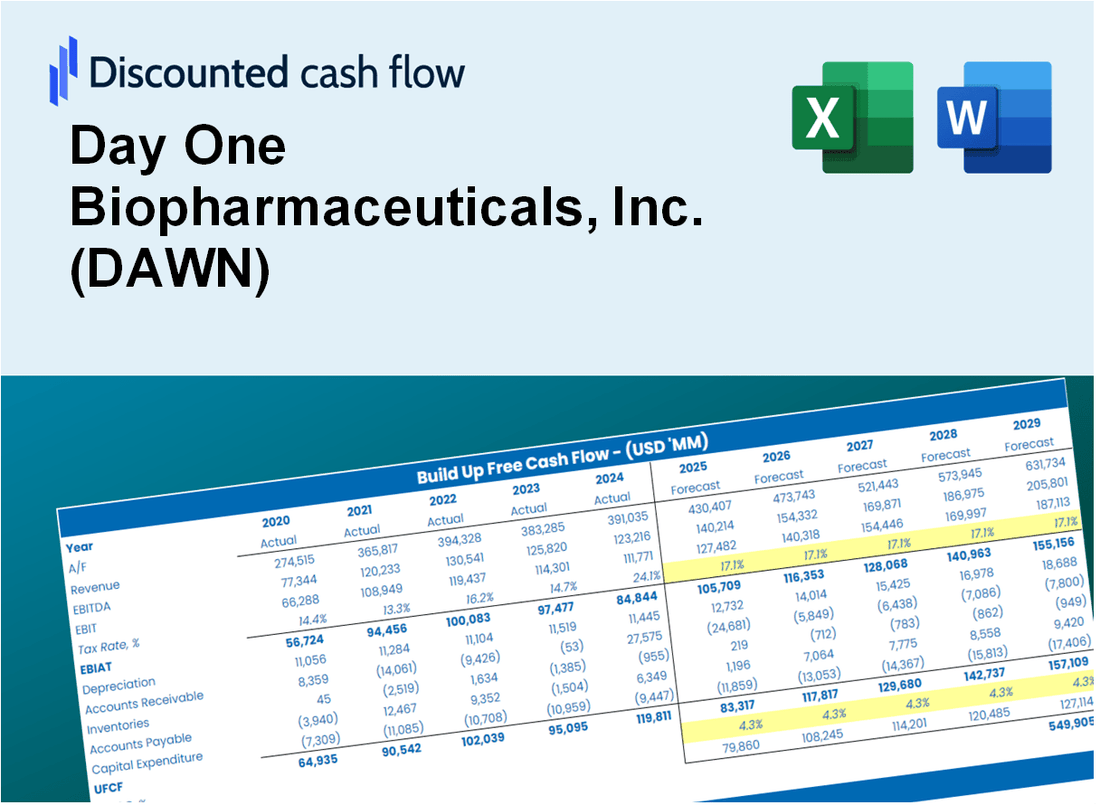
Discounted Cash Flow (DCF) - (USD MM)
| Year | AY1 2020 |
AY2 2021 |
AY3 2022 |
AY4 2023 |
AY5 2024 |
FY1 2025 |
FY2 2026 |
FY3 2027 |
FY4 2028 |
FY5 2029 |
|---|---|---|---|---|---|---|---|---|---|---|
| Revenue | .0 | .0 | .0 | .0 | 131.2 | 131.2 | 131.2 | 131.2 | 131.2 | 131.2 |
| Revenue Growth, % | 0 | 0 | 0 | 0 | 0 | 0 | 0 | 0 | 0 | 0 |
| EBITDA | -43.7 | -72.6 | -141.7 | -206.1 | -217.3 | 78.7 | 78.7 | 78.7 | 78.7 | 78.7 |
| EBITDA, % | 100 | 100 | 100 | 100 | -165.65 | 60 | 60 | 60 | 60 | 60 |
| Depreciation | .2 | .2 | .5 | .4 | 2.0 | 105.3 | 105.3 | 105.3 | 105.3 | 105.3 |
| Depreciation, % | 100 | 100 | 100 | 100 | 1.55 | 80.31 | 80.31 | 80.31 | 80.31 | 80.31 |
| EBIT | -43.8 | -72.8 | -142.2 | -206.4 | -219.3 | 78.7 | 78.7 | 78.7 | 78.7 | 78.7 |
| EBIT, % | 100 | 100 | 100 | 100 | -167.2 | 60 | 60 | 60 | 60 | 60 |
| Total Cash | 43.7 | 284.3 | 342.3 | 366.3 | 531.7 | 131.2 | 131.2 | 131.2 | 131.2 | 131.2 |
| Total Cash, percent | .0 | .0 | .0 | .0 | .0 | .0 | .0 | .0 | .0 | .0 |
| Account Receivables | .0 | .0 | .0 | .0 | 13.9 | 107.7 | 107.7 | 107.7 | 107.7 | 107.7 |
| Account Receivables, % | 100 | 100 | 100 | 100 | 10.58 | 82.12 | 82.12 | 82.12 | 82.12 | 82.12 |
| Inventories | .0 | .0 | .0 | .0 | 3.3 | 105.6 | 105.6 | 105.6 | 105.6 | 105.6 |
| Inventories, % | 100 | 100 | 100 | 100 | 2.53 | 80.51 | 80.51 | 80.51 | 80.51 | 80.51 |
| Accounts Payable | .2 | 1.7 | .3 | 2.6 | 3.3 | 105.6 | 105.6 | 105.6 | 105.6 | 105.6 |
| Accounts Payable, % | 100 | 100 | 100 | 100 | 2.49 | 80.5 | 80.5 | 80.5 | 80.5 | 80.5 |
| Capital Expenditure | -.1 | -8.0 | .0 | -3.2 | -2.2 | -.4 | -.4 | -.4 | -.4 | -.4 |
| Capital Expenditure, % | 100 | 100 | 100 | 100 | -1.65 | -0.33074 | -0.33074 | -0.33074 | -0.33074 | -0.33074 |
| Tax Rate, % | -8.09 | -8.09 | -8.09 | -8.09 | -8.09 | -8.09 | -8.09 | -8.09 | -8.09 | -8.09 |
| EBITAT | -40.5 | -70.4 | -132.2 | -206.4 | -237.0 | 75.9 | 75.9 | 75.9 | 75.9 | 75.9 |
| Depreciation | ||||||||||
| Changes in Account Receivables | ||||||||||
| Changes in Inventories | ||||||||||
| Changes in Accounts Payable | ||||||||||
| Capital Expenditure | ||||||||||
| UFCF | -40.2 | -76.7 | -133.2 | -207.0 | -253.7 | 87.0 | 180.8 | 180.8 | 180.8 | 180.8 |
| WACC, % | 4.53 | 4.53 | 4.53 | 4.53 | 4.53 | 4.53 | 4.53 | 4.53 | 4.53 | 4.53 |
| PV UFCF | ||||||||||
| SUM PV UFCF | 703.3 | |||||||||
| Long Term Growth Rate, % | 2.00 | |||||||||
| Free cash flow (T + 1) | 184 | |||||||||
| Terminal Value | 7,289 | |||||||||
| Present Terminal Value | 5,841 | |||||||||
| Enterprise Value | 6,544 | |||||||||
| Net Debt | -122 | |||||||||
| Equity Value | 6,667 | |||||||||
| Diluted Shares Outstanding, MM | 94 | |||||||||
| Equity Value Per Share | 71.21 |
What You Will Get
- Editable Excel Template: A fully customizable Excel-based DCF Calculator featuring pre-filled real DAWN financials.
- Real-World Data: Historical data and forward-looking estimates (as indicated in the yellow cells).
- Forecast Flexibility: Modify forecast assumptions such as revenue growth, EBITDA %, and WACC.
- Automatic Calculations: Instantly observe how your inputs affect Day One Biopharmaceuticals’ valuation.
- Professional Tool: Designed for investors, CFOs, consultants, and financial analysts.
- User-Friendly Design: Organized for clarity and ease of use, complete with step-by-step instructions.
Key Features
- Comprehensive Financial Data: Gain access to precise pre-loaded historical figures and future forecasts for Day One Biopharmaceuticals, Inc. (DAWN).
- Tailored Forecast Inputs: Modify highlighted cells for key variables such as WACC, growth rates, and profit margins.
- Real-Time Calculations: Automatic updates for DCF, Net Present Value (NPV), and cash flow assessments.
- Interactive Dashboard: User-friendly charts and summaries to effectively visualize your valuation outcomes.
- Designed for All Levels: An easy-to-navigate layout suited for investors, CFOs, and consultants alike.
How It Works
- 1. Access the Template: Download and open the Excel file containing Day One Biopharmaceuticals, Inc.'s (DAWN) preloaded data.
- 2. Adjust Assumptions: Modify key inputs such as growth projections, WACC, and capital investments.
- 3. View Results Instantly: The DCF model automatically calculates the intrinsic value and NPV.
- 4. Explore Scenarios: Analyze various forecasts to evaluate different valuation possibilities.
- 5. Utilize with Assurance: Present professional valuation insights to strengthen your decision-making process.
Why Choose This Calculator?
- Designed for Experts: A specialized tool utilized by researchers, financial analysts, and industry leaders.
- Accurate Data: Day One Biopharmaceuticals' (DAWN) historical and projected financials are preloaded for precision.
- Flexible Scenario Analysis: Effortlessly test various forecasts and assumptions.
- Comprehensive Outputs: Instantly calculates intrinsic value, NPV, and essential metrics.
- User-Friendly: Step-by-step guidance takes you through each stage of the process.
Who Should Use Day One Biopharmaceuticals, Inc. (DAWN)?
- Investors: Gain insights into the biopharmaceutical sector with a comprehensive analysis tool tailored for informed decision-making.
- Financial Analysts: Streamline your workflow with an intuitive model designed specifically for biotech evaluations.
- Consultants: Easily modify the framework for impactful client presentations or detailed reports in the life sciences field.
- Biotech Enthusiasts: Enhance your knowledge of drug development and market strategies through practical case studies.
- Educators and Students: Utilize this resource as a hands-on learning aid in courses focused on biopharmaceutical finance.
What the Template Contains
- Preloaded DAWN Data: Historical and projected financial data, including revenue, EBIT, and capital expenditures.
- DCF and WACC Models: Professional-grade sheets for calculating intrinsic value and Weighted Average Cost of Capital.
- Editable Inputs: Yellow-highlighted cells for adjusting revenue growth, tax rates, and discount rates.
- Financial Statements: Comprehensive annual and quarterly financials for deeper analysis.
- Key Ratios: Profitability, leverage, and efficiency ratios to evaluate performance.
- Dashboard and Charts: Visual summaries of valuation outcomes and assumptions.
Disclaimer
All information, articles, and product details provided on this website are for general informational and educational purposes only. We do not claim any ownership over, nor do we intend to infringe upon, any trademarks, copyrights, logos, brand names, or other intellectual property mentioned or depicted on this site. Such intellectual property remains the property of its respective owners, and any references here are made solely for identification or informational purposes, without implying any affiliation, endorsement, or partnership.
We make no representations or warranties, express or implied, regarding the accuracy, completeness, or suitability of any content or products presented. Nothing on this website should be construed as legal, tax, investment, financial, medical, or other professional advice. In addition, no part of this site—including articles or product references—constitutes a solicitation, recommendation, endorsement, advertisement, or offer to buy or sell any securities, franchises, or other financial instruments, particularly in jurisdictions where such activity would be unlawful.
All content is of a general nature and may not address the specific circumstances of any individual or entity. It is not a substitute for professional advice or services. Any actions you take based on the information provided here are strictly at your own risk. You accept full responsibility for any decisions or outcomes arising from your use of this website and agree to release us from any liability in connection with your use of, or reliance upon, the content or products found herein.