
|
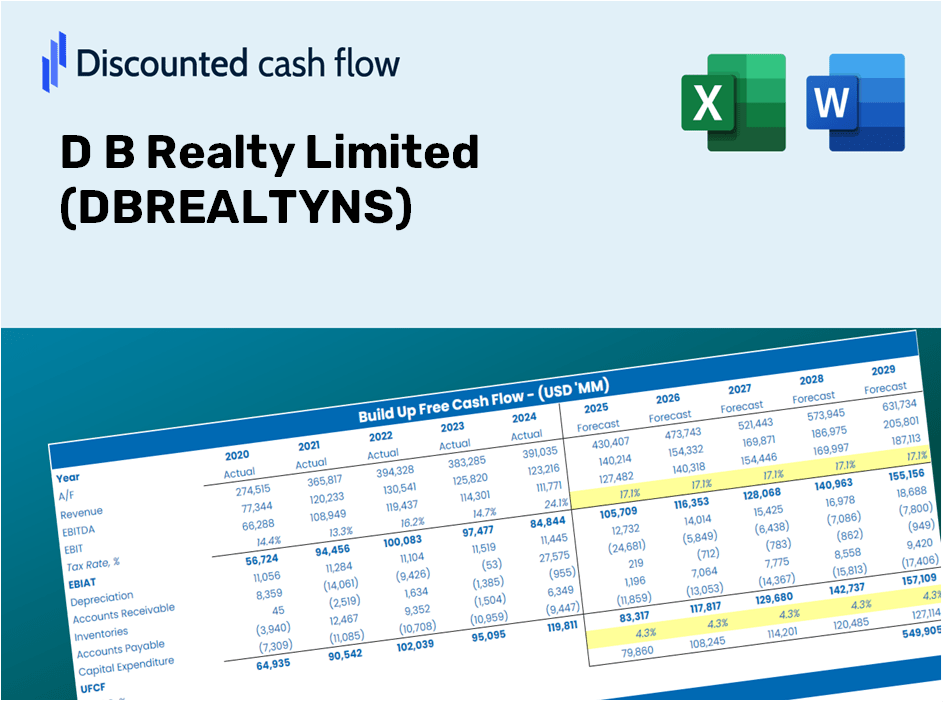
D B Realty Limited (Dbrealty.NS) DCF -Bewertung |
Fully Editable: Tailor To Your Needs In Excel Or Sheets
Professional Design: Trusted, Industry-Standard Templates
Investor-Approved Valuation Models
MAC/PC Compatible, Fully Unlocked
No Expertise Is Needed; Easy To Follow
D B Realty Limited (DBREALTY.NS) Bundle
Enthüllen Sie das wahre Potenzial von D B Realty Limited mit unserem fortschrittlichen DCF -Taschenrechner! Passen Sie die wichtigsten Annahmen an, erkunden Sie verschiedene Szenarien und bewerten Sie die Auswirkungen von Änderungen auf die Bewertung von D B Realty Limited - alles innerhalb einer einzigen Excel -Vorlage.
What You Will Receive
- Editable Forecast Parameters: Easily modify assumptions (growth %, margins, WACC) to generate various scenarios.
- Real-World Data: D B Realty Limited’s (DBREALTYNS) financial information pre-filled to enhance your analysis.
- Automatic DCF Calculations: The template computes Net Present Value (NPV) and intrinsic value for you.
- Customizable and Professional: A refined Excel model tailored to meet your valuation requirements.
- Designed for Analysts and Investors: Perfect for exploring projections, validating strategies, and improving efficiency.
Key Features
- Real-Life DBREALTYNS Data: Pre-loaded with D B Realty Limited’s historical financials and future projections.
- Fully Customizable Inputs: Modify revenue growth, profit margins, discount rates, tax rates, and capital expenditures.
- Dynamic Valuation Model: Automatically updates Net Present Value (NPV) and intrinsic value based on your adjustments.
- Scenario Analysis: Develop multiple forecast scenarios to evaluate various valuation results.
- User-Friendly Interface: Intuitive, well-organized, and tailored for both professionals and newcomers.
How It Functions
- 1. Access the Template: Download and open the Excel file featuring D B Realty Limited’s (DBREALTYNS) preloaded data.
- 2. Modify Assumptions: Adjust critical inputs such as growth rates, WACC, and capital expenditures.
- 3. Instant Results: The DCF model automatically computes intrinsic value and NPV in real-time.
- 4. Explore Scenarios: Evaluate various forecasts to understand different valuation possibilities.
- 5. Present with Assurance: Showcase professional valuation insights to strengthen your decision-making.
Why Choose This Calculator for D B Realty Limited (DBREALTYNS)?
- Designed for Experts: A sophisticated tool tailored for analysts, CFOs, and real estate consultants.
- Comprehensive Data: Historical and projected financials for D B Realty Limited (DBREALTYNS) are preloaded for precise analysis.
- Scenario Analysis: Effortlessly test various forecasts and assumptions.
- Insightful Results: Automatically computes intrinsic value, NPV, and essential metrics.
- User-Friendly: Step-by-step guidance makes navigation simple and intuitive.
Who Can Benefit from This Product?
- Investors: Assess D B Realty Limited's (DBREALTYNS) valuation prior to making buy or sell decisions.
- CFOs and Financial Analysts: Enhance valuation accuracy and evaluate financial forecasts.
- Startup Founders: Gain insights into the valuation methods of leading real estate firms like D B Realty Limited.
- Consultants: Prepare comprehensive valuation reports for your clientele.
- Students and Educators: Utilize current data to practice and instruct on valuation methodologies.
Contents of the Template
- Historical Data: Contains D B Realty Limited’s (DBREALTYNS) previous financials and foundational forecasts.
- DCF and Levered DCF Models: Comprehensive templates for determining the intrinsic value of D B Realty Limited (DBREALTYNS).
- WACC Sheet: Preconfigured calculations for the Weighted Average Cost of Capital.
- Editable Inputs: Adjust essential drivers such as growth rates, EBITDA percentages, and CAPEX assumptions.
- Quarterly and Annual Statements: An in-depth analysis of D B Realty Limited’s (DBREALTYNS) financial performance.
- Interactive Dashboard: Dynamically visualize valuation results and projections.
Disclaimer
All information, articles, and product details provided on this website are for general informational and educational purposes only. We do not claim any ownership over, nor do we intend to infringe upon, any trademarks, copyrights, logos, brand names, or other intellectual property mentioned or depicted on this site. Such intellectual property remains the property of its respective owners, and any references here are made solely for identification or informational purposes, without implying any affiliation, endorsement, or partnership.
We make no representations or warranties, express or implied, regarding the accuracy, completeness, or suitability of any content or products presented. Nothing on this website should be construed as legal, tax, investment, financial, medical, or other professional advice. In addition, no part of this site—including articles or product references—constitutes a solicitation, recommendation, endorsement, advertisement, or offer to buy or sell any securities, franchises, or other financial instruments, particularly in jurisdictions where such activity would be unlawful.
All content is of a general nature and may not address the specific circumstances of any individual or entity. It is not a substitute for professional advice or services. Any actions you take based on the information provided here are strictly at your own risk. You accept full responsibility for any decisions or outcomes arising from your use of this website and agree to release us from any liability in connection with your use of, or reliance upon, the content or products found herein.