
|
DCC Plc (DCC.L) DCF -Bewertung |
Fully Editable: Tailor To Your Needs In Excel Or Sheets
Professional Design: Trusted, Industry-Standard Templates
Investor-Approved Valuation Models
MAC/PC Compatible, Fully Unlocked
No Expertise Is Needed; Easy To Follow
DCC plc (DCC.L) Bundle
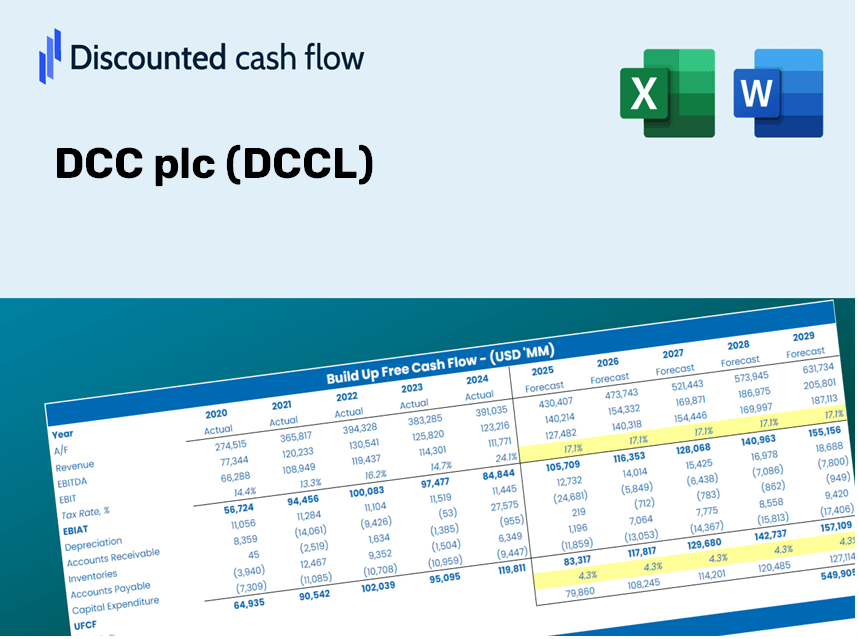
Unabhängig davon, ob Sie ein Investor oder Analyst sind, ist dieser DCC -Taschenrechner DCC (DCCL) Ihr wesentliches Werkzeug für eine genaue Bewertung. Mit echten Daten von DCC Plc vorinstalliert, können Sie Prognosen anpassen und die Auswirkungen in Echtzeit beobachten.
Benefits You Will Receive
- Comprehensive Financial Model: Leveraging DCC plc's actual data for accurate DCF valuations.
- Complete Forecast Flexibility: Modify revenue growth, profit margins, WACC, and other vital inputs as needed.
- Real-Time Calculations: Automatic updates provide immediate insights as adjustments are made.
- Professional-Grade Template: A polished Excel file crafted for high-quality valuation analysis.
- Adaptable and Reusable: Designed for versatility, enabling consistent application for in-depth forecasts.
Key Features
- Authentic DCC plc Financials: Gain access to precise pre-loaded historical data and future forecasts.
- Adjustable Forecast Parameters: Modify yellow-highlighted fields such as WACC, growth rates, and profit margins.
- Real-Time Calculations: Enjoy automatic updates to DCF, Net Present Value (NPV), and cash flow assessments.
- Interactive Dashboard: User-friendly charts and summaries for visualizing your valuation outcomes.
- Designed for All Levels: An easy-to-navigate layout tailored for investors, CFOs, and consultants alike.
How It Operates
- Obtain the Template: Gain immediate access to the Excel-based DCC plc (DCCL) DCF Calculator.
- Enter Your Assumptions: Modify the yellow-highlighted cells for growth rates, WACC, margins, and additional variables.
- Instantaneous Calculations: The model automatically recalculates DCC plc’s (DCCL) intrinsic value.
- Explore Scenarios: Test various assumptions to assess changes in potential valuation.
- Evaluate and Decide: Utilize the outcomes to inform your investment or financial assessment.
Why Choose This Calculator for DCC plc (DCCL)?
- User-Friendly Interface: Perfect for both novices and seasoned users.
- Customizable Inputs: Easily adjust variables to suit your specific analysis needs.
- Real-Time Adjustments: Instantly view updates on DCC plc’s valuation as you modify inputs.
- Pre-Configured Data: Comes with DCC plc’s actual financial figures for swift evaluations.
- Preferred by Industry Experts: Utilized by investors and analysts for making well-informed choices.
Who Can Benefit from DCC plc (DCCL)?
- Individual Investors: Gain insights to make well-informed decisions regarding the purchase or sale of DCC plc (DCCL) shares.
- Financial Analysts: Enhance valuation processes with comprehensive financial models tailored for DCC plc (DCCL).
- Consultants: Provide accurate and timely valuation guidance to clients focused on DCC plc (DCCL).
- Business Owners: Learn how valuations of companies like DCC plc (DCCL) can inform your own business strategies.
- Finance Students: Explore valuation methodologies using real-world data and case studies related to DCC plc (DCCL).
Contents of the Template
- Preloaded DCC plc Data: Historical and projected financial information, including revenue, EBIT, and capital expenditures.
- DCF and WACC Models: Professional-grade spreadsheets for assessing intrinsic value and Weighted Average Cost of Capital.
- Editable Inputs: Yellow-highlighted cells for customizing revenue growth, tax rates, and discount rates.
- Financial Statements: Detailed annual and quarterly financial statements for in-depth analysis.
- Key Ratios: Profitability, leverage, and efficiency ratios for performance assessment.
- Dashboard and Charts: Visual representations of valuation results and underlying assumptions.
Disclaimer
All information, articles, and product details provided on this website are for general informational and educational purposes only. We do not claim any ownership over, nor do we intend to infringe upon, any trademarks, copyrights, logos, brand names, or other intellectual property mentioned or depicted on this site. Such intellectual property remains the property of its respective owners, and any references here are made solely for identification or informational purposes, without implying any affiliation, endorsement, or partnership.
We make no representations or warranties, express or implied, regarding the accuracy, completeness, or suitability of any content or products presented. Nothing on this website should be construed as legal, tax, investment, financial, medical, or other professional advice. In addition, no part of this site—including articles or product references—constitutes a solicitation, recommendation, endorsement, advertisement, or offer to buy or sell any securities, franchises, or other financial instruments, particularly in jurisdictions where such activity would be unlawful.
All content is of a general nature and may not address the specific circumstances of any individual or entity. It is not a substitute for professional advice or services. Any actions you take based on the information provided here are strictly at your own risk. You accept full responsibility for any decisions or outcomes arising from your use of this website and agree to release us from any liability in connection with your use of, or reliance upon, the content or products found herein.