
|
Dingdong Limited (DDL) DCF -Bewertung |
Fully Editable: Tailor To Your Needs In Excel Or Sheets
Professional Design: Trusted, Industry-Standard Templates
Investor-Approved Valuation Models
MAC/PC Compatible, Fully Unlocked
No Expertise Is Needed; Easy To Follow
Dingdong (Cayman) Limited (DDL) Bundle
Unser (DDL) DCF -Taschenrechner entwickelt für Genauigkeit und ermöglicht es Ihnen, die Bewertung der Bewertung von Dingdong (Cayman) bewertet, die mithilfe der tatsächlichen Finanzdaten begrenzt sind, und bietet vollständige Flexibilität, um alle wesentlichen Parameter für erweiterte Projektionen zu ändern.
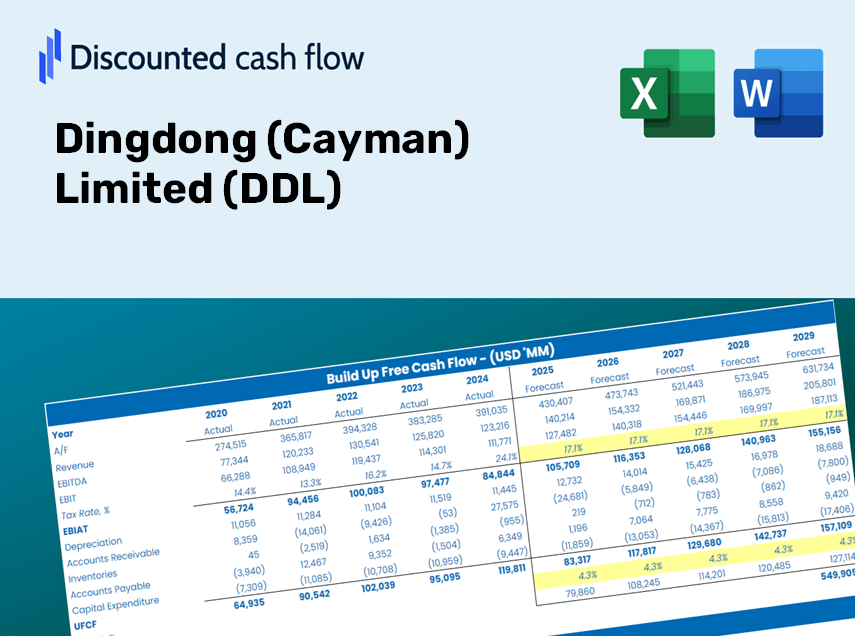
Discounted Cash Flow (DCF) - (USD MM)
| Year | AY1 2020 |
AY2 2021 |
AY3 2022 |
AY4 2023 |
AY5 2024 |
FY1 2025 |
FY2 2026 |
FY3 2027 |
FY4 2028 |
FY5 2029 |
|---|---|---|---|---|---|---|---|---|---|---|
| Revenue | 1,593.5 | 2,828.5 | 3,404.9 | 2,807.5 | 3,242.6 | 4,019.4 | 4,982.3 | 6,175.9 | 7,655.5 | 9,489.6 |
| Revenue Growth, % | 0 | 77.5 | 20.38 | -17.55 | 15.5 | 23.96 | 23.96 | 23.96 | 23.96 | 23.96 |
| EBITDA | -424.9 | -860.3 | -65.0 | 25.6 | 47.4 | -455.1 | -564.2 | -699.3 | -866.9 | -1,074.5 |
| EBITDA, % | -26.67 | -30.41 | -1.91 | 0.91179 | 1.46 | -11.32 | -11.32 | -11.32 | -11.32 | -11.32 |
| Depreciation | 16.2 | 30.0 | 28.7 | 21.8 | 16.1 | 33.7 | 41.8 | 51.8 | 64.2 | 79.6 |
| Depreciation, % | 1.02 | 1.06 | 0.84309 | 0.77612 | 0.49682 | 0.83853 | 0.83853 | 0.83853 | 0.83853 | 0.83853 |
| EBIT | -441.1 | -890.2 | -93.7 | 3.8 | 31.3 | -488.8 | -605.9 | -751.1 | -931.0 | -1,154.1 |
| EBIT, % | -27.68 | -31.47 | -2.75 | 0.13567 | 0.96408 | -12.16 | -12.16 | -12.16 | -12.16 | -12.16 |
| Total Cash | 334.9 | 735.4 | 912.8 | 746.3 | 625.5 | 962.2 | 1,192.7 | 1,478.5 | 1,832.7 | 2,271.7 |
| Total Cash, percent | .0 | .0 | .0 | .0 | .0 | .0 | .0 | .0 | .0 | .0 |
| Account Receivables | 5.5 | 26.9 | 19.9 | 15.2 | 27.9 | 26.4 | 32.7 | 40.5 | 50.2 | 62.2 |
| Account Receivables, % | 0.34232 | 0.95183 | 0.58407 | 0.54017 | 0.85994 | 0.65567 | 0.65567 | 0.65567 | 0.65567 | 0.65567 |
| Inventories | 54.3 | 75.6 | 85.0 | 66.3 | 77.8 | 107.2 | 132.9 | 164.8 | 204.3 | 253.2 |
| Inventories, % | 3.41 | 2.67 | 2.5 | 2.36 | 2.4 | 2.67 | 2.67 | 2.67 | 2.67 | 2.67 |
| Accounts Payable | 222.1 | 289.4 | 265.2 | 199.9 | 233.4 | 372.0 | 461.1 | 571.6 | 708.6 | 878.3 |
| Accounts Payable, % | 13.94 | 10.23 | 7.79 | 7.12 | 7.2 | 9.26 | 9.26 | 9.26 | 9.26 | 9.26 |
| Capital Expenditure | -34.9 | -63.5 | -17.8 | -11.7 | -13.8 | -46.6 | -57.8 | -71.7 | -88.9 | -110.1 |
| Capital Expenditure, % | -2.19 | -2.24 | -0.52387 | -0.41723 | -0.42563 | -1.16 | -1.16 | -1.16 | -1.16 | -1.16 |
| Tax Rate, % | 5 | 5 | 5 | 5 | 5 | 5 | 5 | 5 | 5 | 5 |
| EBITAT | -441.1 | -891.5 | -94.5 | 5.3 | 29.7 | -483.9 | -599.9 | -743.6 | -921.7 | -1,142.6 |
| Depreciation | ||||||||||
| Changes in Account Receivables | ||||||||||
| Changes in Inventories | ||||||||||
| Changes in Accounts Payable | ||||||||||
| Capital Expenditure | ||||||||||
| UFCF | -297.5 | -900.5 | -110.2 | -26.5 | 41.3 | -386.2 | -558.8 | -692.7 | -858.6 | -1,064.3 |
| WACC, % | 4.59 | 4.59 | 4.59 | 4.59 | 4.48 | 4.57 | 4.57 | 4.57 | 4.57 | 4.57 |
| PV UFCF | ||||||||||
| SUM PV UFCF | -3,055.8 | |||||||||
| Long Term Growth Rate, % | 2.00 | |||||||||
| Free cash flow (T + 1) | -1,086 | |||||||||
| Terminal Value | -42,298 | |||||||||
| Present Terminal Value | -33,834 | |||||||||
| Enterprise Value | -36,889 | |||||||||
| Net Debt | 301 | |||||||||
| Equity Value | -37,190 | |||||||||
| Diluted Shares Outstanding, MM | 150 | |||||||||
| Equity Value Per Share | -247.62 |
What You Will Receive
- Authentic DDL Financial Data: Pre-loaded with Dingdong (Cayman) Limited’s historical and forecasted data for accurate analysis.
- Fully Customizable Template: Easily adjust core inputs such as revenue growth, WACC, and EBITDA %.
- Instant Calculations: View DDL’s intrinsic value update in real-time as you modify inputs.
- Professional Valuation Resource: Tailored for investors, analysts, and consultants aiming for precise DCF outcomes.
- User-Friendly Format: Organized layout and straightforward instructions suitable for all skill levels.
Key Features
- 🔍 Real-Life DDL Financials: Pre-filled historical and projected data for Dingdong (Cayman) Limited (DDL).
- ✏️ Fully Customizable Inputs: Modify all essential parameters (yellow cells) such as WACC, growth %, and tax rates.
- 📊 Professional DCF Valuation: Integrated formulas compute DDL’s intrinsic value using the Discounted Cash Flow method.
- ⚡ Instant Results: Visualize DDL’s valuation immediately after adjustments are made.
- Scenario Analysis: Evaluate and compare different outcomes for various financial assumptions side-by-side.
How It Works
- Step 1: Download the Excel file for Dingdong (Cayman) Limited (DDL).
- Step 2: Examine the pre-filled financial information and projections for DDL.
- Step 3: Adjust key parameters such as revenue growth, WACC, and tax rates (highlighted cells).
- Step 4: Observe the DCF model refresh in real time as you modify the assumptions.
- Step 5: Review the outputs to inform your investment strategies.
Why Opt for This Calculator?
- All-in-One Solution: Features DCF, WACC, and comprehensive financial ratio analyses within a single platform.
- Flexible Inputs: Modify the yellow-highlighted cells to explore different scenarios.
- In-Depth Analysis: Automatically computes the intrinsic value and Net Present Value for Dingdong (Cayman) Limited (DDL).
- Pre-Loaded Information: Historical and projected data set a solid foundation for accuracy.
- High-Quality Output: Perfect for financial analysts, investors, and business consultants alike.
Who Can Benefit from This Product?
- Investors: Make informed decisions by accurately assessing the fair value of Dingdong (Cayman) Limited (DDL).
- CFOs: Utilize a robust DCF model for precise financial reporting and analysis.
- Consultants: Efficiently customize the template for client valuation reports.
- Entrepreneurs: Learn from the financial modeling techniques employed by top companies.
- Educators: Implement it as a resource to teach valuation methodologies effectively.
Contents of the Template
- Pre-Filled DCF Model: DDL’s financial data preloaded for immediate application.
- WACC Calculator: Comprehensive calculations for the Weighted Average Cost of Capital.
- Financial Ratios: Assess DDL’s profitability, leverage, and operational efficiency.
- Editable Inputs: Modify assumptions such as growth rates, profit margins, and CAPEX to tailor your scenarios.
- Financial Statements: Annual and quarterly reports for in-depth analysis.
- Interactive Dashboard: Effortlessly visualize key valuation metrics and outcomes.
Disclaimer
All information, articles, and product details provided on this website are for general informational and educational purposes only. We do not claim any ownership over, nor do we intend to infringe upon, any trademarks, copyrights, logos, brand names, or other intellectual property mentioned or depicted on this site. Such intellectual property remains the property of its respective owners, and any references here are made solely for identification or informational purposes, without implying any affiliation, endorsement, or partnership.
We make no representations or warranties, express or implied, regarding the accuracy, completeness, or suitability of any content or products presented. Nothing on this website should be construed as legal, tax, investment, financial, medical, or other professional advice. In addition, no part of this site—including articles or product references—constitutes a solicitation, recommendation, endorsement, advertisement, or offer to buy or sell any securities, franchises, or other financial instruments, particularly in jurisdictions where such activity would be unlawful.
All content is of a general nature and may not address the specific circumstances of any individual or entity. It is not a substitute for professional advice or services. Any actions you take based on the information provided here are strictly at your own risk. You accept full responsibility for any decisions or outcomes arising from your use of this website and agree to release us from any liability in connection with your use of, or reliance upon, the content or products found herein.