
|
Deepak Dünger und Petrochemicals Corporation Limited (Deepakfert.NS) DCF -Bewertung |
Fully Editable: Tailor To Your Needs In Excel Or Sheets
Professional Design: Trusted, Industry-Standard Templates
Investor-Approved Valuation Models
MAC/PC Compatible, Fully Unlocked
No Expertise Is Needed; Easy To Follow
Deepak Fertilisers And Petrochemicals Corporation Limited (DEEPAKFERT.NS) Bundle
Entdecken Sie das finanzielle Potenzial von Deepak-Düngemitteln und Petrochemicals Corporation Limited mit unserem benutzerfreundlichen DCF-Taschenrechner! Geben Sie Ihre Erwartungen an Wachstum, Margen und Ausgaben ein, um den inneren Wert von Deepak -Düngemitteln und Petrochemicals Corporation Limited (Deepakfertns) zu bestimmen und verbessern Sie Ihre Anlagestrategie.
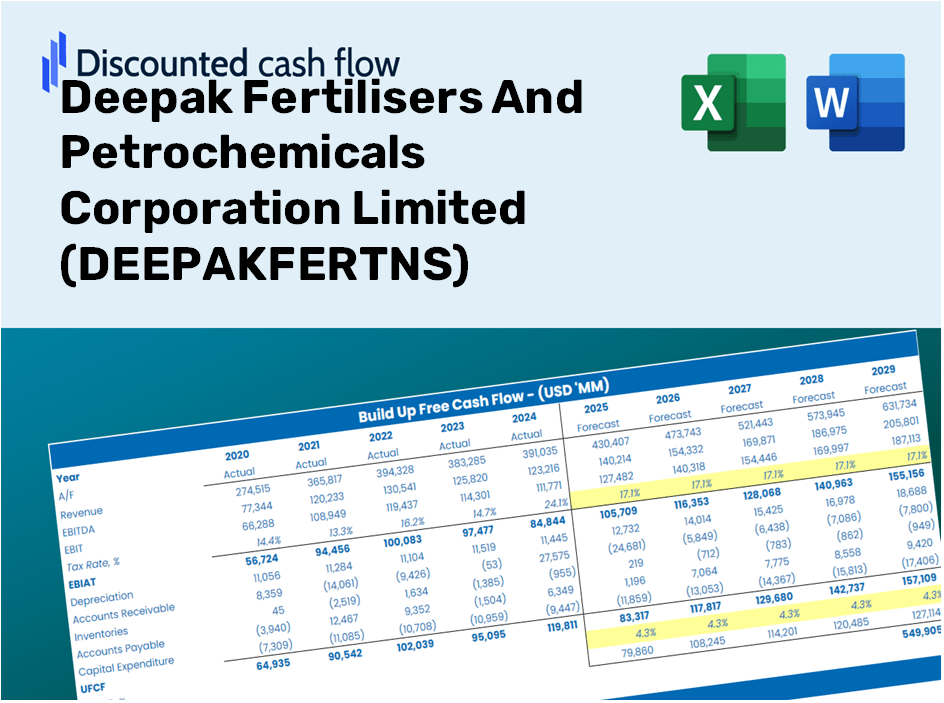
Discounted Cash Flow (DCF) - (USD MM)
| Year | AY1 2021 |
AY2 2022 |
AY3 2023 |
AY4 2024 |
AY5 2025 |
FY1 2026 |
FY2 2027 |
FY3 2028 |
FY4 2029 |
FY5 2030 |
|---|---|---|---|---|---|---|---|---|---|---|
| Revenue | 58,084.9 | 65,694.3 | 113,006.9 | 86,760.9 | 103,552.4 | 98,262.4 | 93,242.6 | 88,479.2 | 83,959.2 | 79,670.1 |
| Revenue Growth, % | 0 | 13.1 | 72.02 | -23.23 | 19.35 | -5.11 | -5.11 | -5.11 | -5.11 | -5.11 |
| EBITDA | 9,669.0 | 13,866.2 | 22,289.6 | 14,094.5 | 20,055.4 | 18,294.5 | 17,359.9 | 16,473.1 | 15,631.6 | 14,833.0 |
| EBITDA, % | 16.65 | 21.11 | 19.72 | 16.25 | 19.37 | 18.62 | 18.62 | 18.62 | 18.62 | 18.62 |
| Depreciation | 2,119.5 | 2,325.2 | 2,392.1 | 3,337.3 | 4,033.3 | 3,350.1 | 3,178.9 | 3,016.5 | 2,862.4 | 2,716.2 |
| Depreciation, % | 3.65 | 3.54 | 2.12 | 3.85 | 3.89 | 3.41 | 3.41 | 3.41 | 3.41 | 3.41 |
| EBIT | 7,549.5 | 11,541.0 | 19,897.5 | 10,757.2 | 16,022.1 | 14,944.4 | 14,181.0 | 13,456.5 | 12,769.1 | 12,116.8 |
| EBIT, % | 13 | 17.57 | 17.61 | 12.4 | 15.47 | 15.21 | 15.21 | 15.21 | 15.21 | 15.21 |
| Total Cash | 7,163.3 | 11,581.9 | 11,078.1 | 6,276.5 | 6,272.3 | 10,427.0 | 9,894.3 | 9,388.9 | 8,909.2 | 8,454.1 |
| Total Cash, percent | .0 | .0 | .0 | .0 | .0 | .0 | .0 | .0 | .0 | .0 |
| Account Receivables | 9,234.1 | 6,332.3 | 17,696.4 | 14,757.5 | 16,181.8 | 14,509.9 | 13,768.6 | 13,065.2 | 12,397.8 | 11,764.4 |
| Account Receivables, % | 15.9 | 9.64 | 15.66 | 17.01 | 15.63 | 14.77 | 14.77 | 14.77 | 14.77 | 14.77 |
| Inventories | 6,605.1 | 10,937.5 | 13,224.6 | 12,476.1 | 10,688.0 | 12,661.0 | 12,014.2 | 11,400.4 | 10,818.0 | 10,265.4 |
| Inventories, % | 11.37 | 16.65 | 11.7 | 14.38 | 10.32 | 12.88 | 12.88 | 12.88 | 12.88 | 12.88 |
| Accounts Payable | 12,967.6 | 14,156.5 | 17,773.6 | 12,848.6 | 17,135.5 | 17,875.7 | 16,962.5 | 16,096.0 | 15,273.7 | 14,493.4 |
| Accounts Payable, % | 22.33 | 21.55 | 15.73 | 14.81 | 16.55 | 18.19 | 18.19 | 18.19 | 18.19 | 18.19 |
| Capital Expenditure | -2,365.4 | -9,900.4 | -12,093.8 | -8,847.9 | -11,356.3 | -10,024.6 | -9,512.5 | -9,026.5 | -8,565.4 | -8,127.8 |
| Capital Expenditure, % | -4.07 | -15.07 | -10.7 | -10.2 | -10.97 | -10.2 | -10.2 | -10.2 | -10.2 | -10.2 |
| Tax Rate, % | 21.5 | 21.5 | 21.5 | 21.5 | 21.5 | 21.5 | 21.5 | 21.5 | 21.5 | 21.5 |
| EBITAT | 5,136.9 | 7,731.0 | 13,262.3 | 7,084.0 | 12,577.3 | 10,342.7 | 9,814.3 | 9,312.9 | 8,837.2 | 8,385.7 |
| Depreciation | ||||||||||
| Changes in Account Receivables | ||||||||||
| Changes in Inventories | ||||||||||
| Changes in Accounts Payable | ||||||||||
| Capital Expenditure | ||||||||||
| UFCF | 2,019.4 | -85.9 | -6,473.5 | 335.8 | 9,905.0 | 4,107.3 | 3,955.6 | 3,753.5 | 3,561.8 | 3,379.8 |
| WACC, % | 5.03 | 5.01 | 5.01 | 4.99 | 5.21 | 5.05 | 5.05 | 5.05 | 5.05 | 5.05 |
| PV UFCF | ||||||||||
| SUM PV UFCF | 16,297.9 | |||||||||
| Long Term Growth Rate, % | 3.00 | |||||||||
| Free cash flow (T + 1) | 3,481 | |||||||||
| Terminal Value | 169,655 | |||||||||
| Present Terminal Value | 132,601 | |||||||||
| Enterprise Value | 148,899 | |||||||||
| Net Debt | 37,086 | |||||||||
| Equity Value | 111,813 | |||||||||
| Diluted Shares Outstanding, MM | 126 | |||||||||
| Equity Value Per Share | 885.68 |
What You Will Receive
- Authentic DEEPAKFERTNS Financial Data: Pre-loaded with historical and projected figures for accurate analysis.
- Completely Customizable Template: Easily adjust key variables such as revenue growth, WACC, and EBITDA percentage.
- Instantaneous Calculations: Observe real-time updates to DEEPAKFERTNS's intrinsic value as you make adjustments.
- Professional Valuation Tool: Tailored for investors, analysts, and consultants in pursuit of precise DCF outcomes.
- User-Centric Design: Intuitive layout and clear guidance suitable for all experience levels.
Key Features
- Customizable Input Parameters: Adjust essential metrics such as revenue growth, EBITDA percentage, and capital expenditures.
- Instant DCF Valuation: Quickly computes intrinsic value, net present value, and other key financial outputs.
- High-Quality Precision: Utilizes Deepak Fertilisers' actual financial data for dependable valuation results.
- Simplified Scenario Analysis: Effortlessly evaluate various assumptions and analyze results side by side.
- Efficient Tool: Avoid the hassle of constructing intricate valuation models from the ground up.
How It Works
- Step 1: Download the prebuilt Excel template featuring data for Deepak Fertilisers And Petrochemicals Corporation Limited (DEEPAKFERTNS).
- Step 2: Review the pre-filled spreadsheets to familiarize yourself with essential metrics.
- Step 3: Modify forecasts and assumptions in the editable yellow cells (WACC, growth rates, margins).
- Step 4: Instantly see updated results, including the intrinsic value of Deepak Fertilisers (DEEPAKFERTNS).
- Step 5: Use the outputs to make informed investment decisions or create comprehensive reports.
Why Choose This Calculator for Deepak Fertilisers And Petrochemicals Corporation Limited (DEEPAKFERTNS)?
- All-in-One Solution: Offers comprehensive analyses including DCF, WACC, and key financial ratios.
- Flexible Customization: Modify the yellow-highlighted cells to explore different financial scenarios.
- In-Depth Analysis: Automatically computes the intrinsic value and Net Present Value for Deepak Fertilisers.
- Pre-Loaded Information: Comes with historical and projected data for reliable baseline assessments.
- High-Quality Standards: Perfectly suited for financial analysts, investors, and business consultants.
Who Can Benefit from Deepak Fertilisers and Petrochemicals Corporation Limited (DEEPAKFERTNS)?
- Investors: Make informed investment choices with our comprehensive valuation tools.
- Financial Analysts: Enhance efficiency using our customizable DCF model designed for quick analysis.
- Consultants: Easily modify the template for impactful client presentations and reports.
- Finance Enthusiasts: Expand your knowledge of valuation strategies through practical, real-world applications.
- Educators and Students: Utilize this resource as a valuable educational tool for finance courses.
What the Template Contains
- Historical Data: Contains Deepak Fertilisers' past financials and baseline forecasts.
- DCF and Levered DCF Models: Comprehensive templates to assess the intrinsic value of Deepak Fertilisers.
- WACC Sheet: Pre-constructed calculations for Weighted Average Cost of Capital.
- Editable Inputs: Customize key drivers such as growth rates, EBITDA %, and CAPEX forecasts.
- Quarterly and Annual Statements: A thorough analysis of Deepak Fertilisers' financial performance.
- Interactive Dashboard: Visualize valuation outcomes and projections in an engaging way.
Disclaimer
All information, articles, and product details provided on this website are for general informational and educational purposes only. We do not claim any ownership over, nor do we intend to infringe upon, any trademarks, copyrights, logos, brand names, or other intellectual property mentioned or depicted on this site. Such intellectual property remains the property of its respective owners, and any references here are made solely for identification or informational purposes, without implying any affiliation, endorsement, or partnership.
We make no representations or warranties, express or implied, regarding the accuracy, completeness, or suitability of any content or products presented. Nothing on this website should be construed as legal, tax, investment, financial, medical, or other professional advice. In addition, no part of this site—including articles or product references—constitutes a solicitation, recommendation, endorsement, advertisement, or offer to buy or sell any securities, franchises, or other financial instruments, particularly in jurisdictions where such activity would be unlawful.
All content is of a general nature and may not address the specific circumstances of any individual or entity. It is not a substitute for professional advice or services. Any actions you take based on the information provided here are strictly at your own risk. You accept full responsibility for any decisions or outcomes arising from your use of this website and agree to release us from any liability in connection with your use of, or reliance upon, the content or products found herein.