
|
Vinci SA (DG.PA) DCF -Bewertung |
Fully Editable: Tailor To Your Needs In Excel Or Sheets
Professional Design: Trusted, Industry-Standard Templates
Investor-Approved Valuation Models
MAC/PC Compatible, Fully Unlocked
No Expertise Is Needed; Easy To Follow
Vinci SA (DG.PA) Bundle
Verbessern Sie Ihre Anlagestrategien mit dem DCF -Taschenrechner von Vinci SA (DGPA)! Verwenden Sie authentische Vinci -Finanzdaten, passen Sie Wachstumsprojektionen und -kosten an und beobachten Sie sofort, wie sich diese Modifikationen auf den inneren Wert von Vinci auswirken.
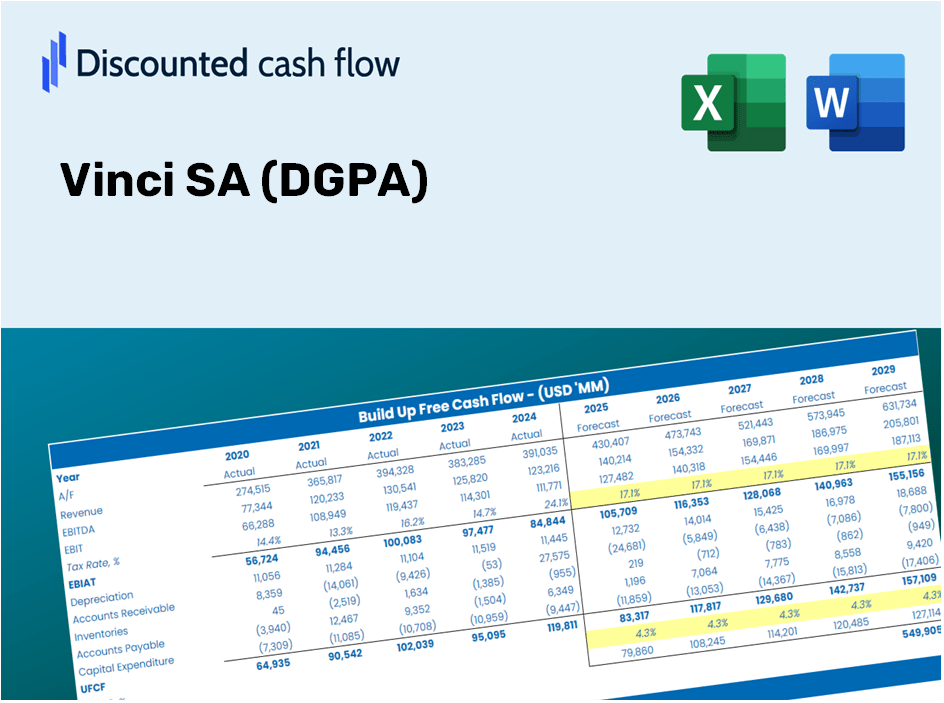
Discounted Cash Flow (DCF) - (USD MM)
| Year | AY1 2020 |
AY2 2021 |
AY3 2022 |
AY4 2023 |
AY5 2024 |
FY1 2025 |
FY2 2026 |
FY3 2027 |
FY4 2028 |
FY5 2029 |
|---|---|---|---|---|---|---|---|---|---|---|
| Revenue | 44,118.0 | 50,230.0 | 62,514.0 | 69,885.0 | 72,768.0 | 82,632.7 | 93,834.7 | 106,555.3 | 121,000.4 | 137,403.7 |
| Revenue Growth, % | 0 | 13.85 | 24.46 | 11.79 | 4.13 | 13.56 | 13.56 | 13.56 | 13.56 | 13.56 |
| EBITDA | 5,884.0 | 7,723.0 | 10,536.0 | 11,810.0 | 12,784.0 | 13,226.8 | 15,019.8 | 17,056.0 | 19,368.1 | 21,993.8 |
| EBITDA, % | 13.34 | 15.38 | 16.85 | 16.9 | 17.57 | 16.01 | 16.01 | 16.01 | 16.01 | 16.01 |
| Depreciation | 3,171.0 | 3,219.0 | 3,613.0 | 3,800.0 | 3,998.0 | 5,008.7 | 5,687.7 | 6,458.8 | 7,334.4 | 8,328.7 |
| Depreciation, % | 7.19 | 6.41 | 5.78 | 5.44 | 5.49 | 6.06 | 6.06 | 6.06 | 6.06 | 6.06 |
| EBIT | 2,713.0 | 4,504.0 | 6,923.0 | 8,010.0 | 8,786.0 | 8,218.0 | 9,332.1 | 10,597.2 | 12,033.8 | 13,665.1 |
| EBIT, % | 6.15 | 8.97 | 11.07 | 11.46 | 12.07 | 9.95 | 9.95 | 9.95 | 9.95 | 9.95 |
| Total Cash | 11,902.0 | 11,265.0 | 13,333.0 | 16,172.0 | 16,170.0 | 19,186.4 | 21,787.4 | 24,741.0 | 28,095.0 | 31,903.7 |
| Total Cash, percent | .0 | .0 | .0 | .0 | .0 | .0 | .0 | .0 | .0 | .0 |
| Account Receivables | 12,771.0 | 16,148.0 | 18,092.0 | 19,103.0 | 19,365.0 | 23,795.4 | 27,021.2 | 30,684.3 | 34,844.0 | 39,567.6 |
| Account Receivables, % | 28.95 | 32.15 | 28.94 | 27.33 | 26.61 | 28.8 | 28.8 | 28.8 | 28.8 | 28.8 |
| Inventories | 1,428.0 | 1,591.0 | 1,785.0 | 1,878.0 | 1,772.0 | 2,376.8 | 2,699.1 | 3,065.0 | 3,480.4 | 3,952.3 |
| Inventories, % | 3.24 | 3.17 | 2.86 | 2.69 | 2.44 | 2.88 | 2.88 | 2.88 | 2.88 | 2.88 |
| Accounts Payable | 8,876.0 | 12,027.0 | 13,088.0 | 13,572.0 | 14,463.0 | 17,236.3 | 19,572.9 | 22,226.3 | 25,239.4 | 28,661.0 |
| Accounts Payable, % | 20.12 | 23.94 | 20.94 | 19.42 | 19.88 | 20.86 | 20.86 | 20.86 | 20.86 | 20.86 |
| Capital Expenditure | -2,160.0 | -2,063.0 | -3,501.0 | -3,332.0 | -4,052.0 | -4,121.7 | -4,680.4 | -5,314.9 | -6,035.4 | -6,853.6 |
| Capital Expenditure, % | -4.9 | -4.11 | -5.6 | -4.77 | -5.57 | -4.99 | -4.99 | -4.99 | -4.99 | -4.99 |
| Tax Rate, % | 34.07 | 34.07 | 34.07 | 34.07 | 34.07 | 34.07 | 34.07 | 34.07 | 34.07 | 34.07 |
| EBITAT | 1,848.4 | 3,062.0 | 4,792.0 | 5,365.9 | 5,792.6 | 5,559.5 | 6,313.2 | 7,169.0 | 8,140.9 | 9,244.5 |
| Depreciation | ||||||||||
| Changes in Account Receivables | ||||||||||
| Changes in Inventories | ||||||||||
| Changes in Accounts Payable | ||||||||||
| Capital Expenditure | ||||||||||
| UFCF | -2,463.6 | 3,829.0 | 3,827.0 | 5,213.9 | 6,473.6 | 4,184.6 | 6,109.1 | 6,937.3 | 7,877.8 | 8,945.7 |
| WACC, % | 6.16 | 6.16 | 6.18 | 6.15 | 6.13 | 6.16 | 6.16 | 6.16 | 6.16 | 6.16 |
| PV UFCF | ||||||||||
| SUM PV UFCF | 28,000.2 | |||||||||
| Long Term Growth Rate, % | 1.00 | |||||||||
| Free cash flow (T + 1) | 9,035 | |||||||||
| Terminal Value | 175,192 | |||||||||
| Present Terminal Value | 129,947 | |||||||||
| Enterprise Value | 157,947 | |||||||||
| Net Debt | 21,062 | |||||||||
| Equity Value | 136,885 | |||||||||
| Diluted Shares Outstanding, MM | 577 | |||||||||
| Equity Value Per Share | 237.42 |
What You Will Receive
- Authentic DGPA Financial Data: Pre-loaded with Vinci SA’s historical and forecasted figures for accurate analysis.
- Comprehensive Editable Template: Easily adjust essential inputs such as revenue growth, WACC, and EBITDA %.
- Instant Calculations: Observe Vinci SA’s intrinsic value update dynamically as you make changes.
- Expert Valuation Tool: Tailored for investors, analysts, and consultants aiming for precise DCF outcomes.
- User-Friendly Interface: Intuitive layout and straightforward instructions suitable for all experience levels.
Key Features
- Comprehensive DCF Calculator: Offers in-depth unlevered and levered DCF valuation models tailored for Vinci SA (DGPA).
- WACC Estimator: Comes with a pre-structured Weighted Average Cost of Capital sheet featuring customizable parameters.
- Editable Forecast Assumptions: Adjust growth rates, capital expenditures, and discount rates as needed.
- Integrated Financial Ratios: Evaluate profitability, leverage, and efficiency ratios specifically for Vinci SA (DGPA).
- Dashboard and Visual Charts: Graphical representations summarize essential valuation metrics for straightforward analysis.
How It Works
- Step 1: Download the Excel file for Vinci SA (DGPA).
- Step 2: Examine the pre-filled financial data and projections for Vinci SA (DGPA).
- Step 3: Adjust key inputs such as revenue growth, WACC, and tax rates (highlighted cells).
- Step 4: Observe the DCF model update in real-time as you modify your assumptions.
- Step 5: Review the outputs and leverage the results for your investment strategies.
Why Opt for This Calculator?
- All-in-One Tool: Combines DCF, WACC, and financial ratio analyses for comprehensive evaluation.
- Adjustable Inputs: Modify the yellow-highlighted fields to explore different scenarios.
- In-Depth Analysis: Automatically determines Vinci SA’s intrinsic value and Net Present Value.
- Pre-Loaded Information: Access historical and projected data for accurate baseline assessments.
- High-Quality Standards: Perfect for financial analysts, investors, and business consultants working with Vinci SA (DGPA).
Who Should Use This Product?
- Investors: Accurately assess Vinci SA’s fair value before making investment choices.
- CFOs: Utilize a professional-grade DCF model for financial analysis and reporting.
- Consultants: Efficiently customize the template for client valuation reports.
- Entrepreneurs: Acquire insights into the financial modeling practices of major corporations.
- Educators: Employ it as a teaching resource to illustrate valuation techniques.
Contents of the Template
- Operating and Balance Sheet Data: Pre-filled historical data and forecasts for Vinci SA (DGPA), including metrics such as revenue, EBITDA, EBIT, and capital expenditures.
- WACC Calculation: A dedicated sheet for calculating the Weighted Average Cost of Capital (WACC), incorporating parameters like Beta, the risk-free rate, and share price.
- DCF Valuation (Unlevered and Levered): Customizable Discounted Cash Flow models that illustrate intrinsic value with comprehensive calculations.
- Financial Statements: Pre-loaded financial statements (annual and quarterly) to facilitate thorough analysis.
- Key Ratios: Provides profitability, leverage, and efficiency ratios relevant to Vinci SA (DGPA).
- Dashboard and Charts: A visual overview of valuation outputs and assumptions for easy result analysis.
Disclaimer
All information, articles, and product details provided on this website are for general informational and educational purposes only. We do not claim any ownership over, nor do we intend to infringe upon, any trademarks, copyrights, logos, brand names, or other intellectual property mentioned or depicted on this site. Such intellectual property remains the property of its respective owners, and any references here are made solely for identification or informational purposes, without implying any affiliation, endorsement, or partnership.
We make no representations or warranties, express or implied, regarding the accuracy, completeness, or suitability of any content or products presented. Nothing on this website should be construed as legal, tax, investment, financial, medical, or other professional advice. In addition, no part of this site—including articles or product references—constitutes a solicitation, recommendation, endorsement, advertisement, or offer to buy or sell any securities, franchises, or other financial instruments, particularly in jurisdictions where such activity would be unlawful.
All content is of a general nature and may not address the specific circumstances of any individual or entity. It is not a substitute for professional advice or services. Any actions you take based on the information provided here are strictly at your own risk. You accept full responsibility for any decisions or outcomes arising from your use of this website and agree to release us from any liability in connection with your use of, or reliance upon, the content or products found herein.