
|
Sartorius Stedim Biotech S.A. (Dim.Pa) DCF -Bewertung |
Fully Editable: Tailor To Your Needs In Excel Or Sheets
Professional Design: Trusted, Industry-Standard Templates
Investor-Approved Valuation Models
MAC/PC Compatible, Fully Unlocked
No Expertise Is Needed; Easy To Follow
Sartorius Stedim Biotech S.A. (DIM.PA) Bundle
Optimieren Sie Ihre Zeit und steigern Sie die Präzision mit unserem (DIMPA) DCF -Taschenrechner! Mit tatsächlichen Daten von Sartorius Stedim Biotech S.A. und anpassbaren Annahmen ermöglichen dieses Tool Sie, wie ein erfahrener Investor zu prognostizieren, zu analysieren und zu bewerten (DIMPA).
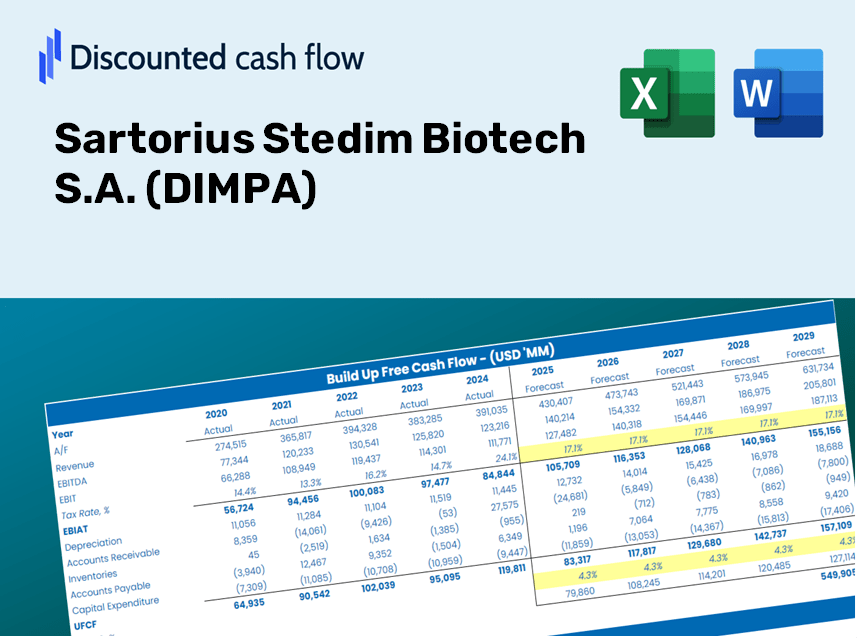
Discounted Cash Flow (DCF) - (USD MM)
| Year | AY1 2020 |
AY2 2021 |
AY3 2022 |
AY4 2023 |
AY5 2024 |
FY1 2025 |
FY2 2026 |
FY3 2027 |
FY4 2028 |
FY5 2029 |
|---|---|---|---|---|---|---|---|---|---|---|
| Revenue | 1,910.1 | 2,887.0 | 3,492.7 | 2,775.5 | 2,780.0 | 3,139.7 | 3,545.9 | 4,004.7 | 4,522.8 | 5,108.0 |
| Revenue Growth, % | 0 | 51.14 | 20.98 | -20.53 | 0.16213 | 12.94 | 12.94 | 12.94 | 12.94 | 12.94 |
| EBITDA | 623.8 | 812.0 | 1,353.1 | 755.7 | 670.5 | 947.4 | 1,069.9 | 1,208.4 | 1,364.7 | 1,541.3 |
| EBITDA, % | 32.66 | 28.12 | 38.74 | 27.23 | 24.12 | 30.17 | 30.17 | 30.17 | 30.17 | 30.17 |
| Depreciation | 101.7 | 141.6 | 181.7 | 237.6 | 301.7 | 218.8 | 247.1 | 279.1 | 315.2 | 356.0 |
| Depreciation, % | 5.32 | 4.9 | 5.2 | 8.56 | 10.85 | 6.97 | 6.97 | 6.97 | 6.97 | 6.97 |
| EBIT | 522.1 | 670.4 | 1,171.4 | 518.1 | 368.8 | 728.6 | 822.8 | 929.3 | 1,049.5 | 1,185.3 |
| EBIT, % | 27.33 | 23.22 | 33.54 | 18.67 | 13.27 | 23.21 | 23.21 | 23.21 | 23.21 | 23.21 |
| Total Cash | 69.6 | 237.3 | 133.0 | 126.1 | 688.8 | 282.5 | 319.1 | 360.4 | 407.0 | 459.7 |
| Total Cash, percent | .0 | .0 | .0 | .0 | .0 | .0 | .0 | .0 | .0 | .0 |
| Account Receivables | 264.0 | 371.7 | 418.6 | 293.7 | 266.8 | 369.6 | 417.4 | 471.4 | 532.4 | 601.3 |
| Account Receivables, % | 13.82 | 12.88 | 11.98 | 10.58 | 9.6 | 11.77 | 11.77 | 11.77 | 11.77 | 11.77 |
| Inventories | 472.3 | 783.0 | 1,024.8 | 882.4 | 684.9 | 864.2 | 976.0 | 1,102.2 | 1,244.8 | 1,405.9 |
| Inventories, % | 24.73 | 27.12 | 29.34 | 31.79 | 24.64 | 27.52 | 27.52 | 27.52 | 27.52 | 27.52 |
| Accounts Payable | 174.7 | 251.3 | 251.5 | 258.5 | 310.0 | 285.8 | 322.8 | 364.6 | 411.7 | 465.0 |
| Accounts Payable, % | 9.15 | 8.7 | 7.2 | 9.31 | 11.15 | 9.1 | 9.1 | 9.1 | 9.1 | 9.1 |
| Capital Expenditure | -159.2 | -324.0 | -430.6 | -473.6 | -339.8 | -384.1 | -433.8 | -489.9 | -553.3 | -624.9 |
| Capital Expenditure, % | -8.33 | -11.22 | -12.33 | -17.06 | -12.22 | -12.23 | -12.23 | -12.23 | -12.23 | -12.23 |
| Tax Rate, % | 20.12 | 20.12 | 20.12 | 20.12 | 20.12 | 20.12 | 20.12 | 20.12 | 20.12 | 20.12 |
| EBITAT | 363.4 | 429.6 | 907.9 | 400.0 | 294.6 | 536.6 | 606.1 | 684.5 | 773.1 | 873.1 |
| Depreciation | ||||||||||
| Changes in Account Receivables | ||||||||||
| Changes in Inventories | ||||||||||
| Changes in Accounts Payable | ||||||||||
| Capital Expenditure | ||||||||||
| UFCF | -255.6 | -94.7 | 370.4 | 438.3 | 532.4 | 65.1 | 296.7 | 335.1 | 378.4 | 427.4 |
| WACC, % | 7.29 | 7.25 | 7.35 | 7.35 | 7.36 | 7.32 | 7.32 | 7.32 | 7.32 | 7.32 |
| PV UFCF | ||||||||||
| SUM PV UFCF | 1,174.8 | |||||||||
| Long Term Growth Rate, % | 3.00 | |||||||||
| Free cash flow (T + 1) | 440 | |||||||||
| Terminal Value | 10,188 | |||||||||
| Present Terminal Value | 7,156 | |||||||||
| Enterprise Value | 8,331 | |||||||||
| Net Debt | 2,191 | |||||||||
| Equity Value | 6,140 | |||||||||
| Diluted Shares Outstanding, MM | 97 | |||||||||
| Equity Value Per Share | 63.45 |
What You Will Receive
- Customizable Excel Template: A comprehensive Excel-based DCF Calculator featuring pre-filled financial data for Sartorius Stedim Biotech S.A. (DIMPA).
- Accurate Data: Access to historical performance metrics and future projections (highlighted in the yellow cells).
- Adjustable Forecasts: Modify key assumptions such as revenue growth, EBITDA percentage, and WACC.
- Instant Calculations: Quickly observe how your adjustments affect the valuation of Sartorius Stedim Biotech S.A. (DIMPA).
- Professional Resource: Designed for investors, CFOs, consultants, and financial analysts.
- Intuitive Layout: Organized for simplicity and ease of navigation, complete with step-by-step guidance.
Key Features
- Real-Life DIMPA Data: Pre-filled with Sartorius Stedim Biotech’s historical financial figures and forward-looking forecasts.
- Fully Customizable Inputs: Modify revenue growth, profit margins, WACC, tax rates, and capital expenditures to fit your analysis.
- Dynamic Valuation Model: Automatic recalculation of Net Present Value (NPV) and intrinsic value based on your adjustments.
- Scenario Testing: Generate multiple forecasting scenarios to evaluate various valuation possibilities.
- User-Friendly Design: Intuitive, organized, and suitable for both professionals and novices.
How It Functions
- 1. Access the Template: Download and open the Excel file containing Sartorius Stedim Biotech S.A.’s (DIMPA) preloaded data.
- 2. Modify Assumptions: Adjust essential inputs such as growth rates, WACC, and capital expenditures.
- 3. Review Results Immediately: The DCF model automatically calculates intrinsic value and NPV in real-time.
- 4. Explore Scenarios: Analyze various forecasts to evaluate different valuation results.
- 5. Utilize with Assurance: Present expert valuation insights to bolster your decision-making.
Why Opt for This Calculator?
- Precise Data: Genuine Sartorius Stedim Biotech financials guarantee trustworthy valuation outcomes.
- Customizable: Modify essential parameters such as growth rates, WACC, and tax rates to align with your forecasts.
- Time-Efficient: Built-in calculations save you the hassle of starting from scratch.
- Professional-Grade Tool: Tailored for investors, analysts, and consultants in the biotech field.
- User-Friendly: Intuitive design and step-by-step guidance make it accessible for everyone.
Who Should Utilize This Product?
- Investors: Precisely assess the fair value of Sartorius Stedim Biotech S.A. (DIMPA) before making investment choices.
- CFOs: Utilize an advanced DCF model for detailed financial reporting and analysis.
- Consultants: Swiftly customize the template for client valuation reports.
- Entrepreneurs: Acquire valuable insights into financial modeling practices employed by leading biotechnology firms.
- Educators: Implement it as a resource to illustrate various valuation techniques.
Contents of the Template
- Pre-Filled Data: Contains Sartorius Stedim Biotech S.A. (DIMPA) historical financials and projections.
- Discounted Cash Flow Model: An editable DCF valuation model featuring automated calculations.
- Weighted Average Cost of Capital (WACC): A specific sheet for WACC calculation based on user-defined inputs.
- Key Financial Ratios: Assess Sartorius Stedim Biotech S.A. (DIMPA)’s profitability, efficiency, and leverage metrics.
- Customizable Inputs: Easily modify revenue growth, margins, and tax rates.
- User-Friendly Dashboard: Visual representations and tables summarizing essential valuation outcomes.
Disclaimer
All information, articles, and product details provided on this website are for general informational and educational purposes only. We do not claim any ownership over, nor do we intend to infringe upon, any trademarks, copyrights, logos, brand names, or other intellectual property mentioned or depicted on this site. Such intellectual property remains the property of its respective owners, and any references here are made solely for identification or informational purposes, without implying any affiliation, endorsement, or partnership.
We make no representations or warranties, express or implied, regarding the accuracy, completeness, or suitability of any content or products presented. Nothing on this website should be construed as legal, tax, investment, financial, medical, or other professional advice. In addition, no part of this site—including articles or product references—constitutes a solicitation, recommendation, endorsement, advertisement, or offer to buy or sell any securities, franchises, or other financial instruments, particularly in jurisdictions where such activity would be unlawful.
All content is of a general nature and may not address the specific circumstances of any individual or entity. It is not a substitute for professional advice or services. Any actions you take based on the information provided here are strictly at your own risk. You accept full responsibility for any decisions or outcomes arising from your use of this website and agree to release us from any liability in connection with your use of, or reliance upon, the content or products found herein.