
|
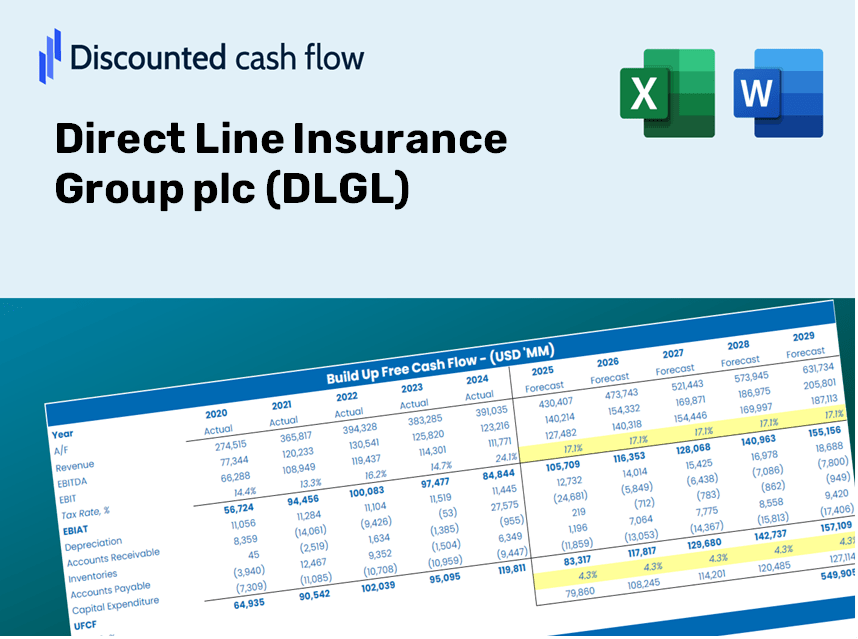
DIRECT LINE Insurance Group PLC (DLG.L) DCF -Bewertung |
Fully Editable: Tailor To Your Needs In Excel Or Sheets
Professional Design: Trusted, Industry-Standard Templates
Investor-Approved Valuation Models
MAC/PC Compatible, Fully Unlocked
No Expertise Is Needed; Easy To Follow
Direct Line Insurance Group plc (DLG.L) Bundle
Verbessern Sie Ihre Anlagestrategien mit dem DCF -Taschenrechner der Direct Line Insurance Group PLC (DLGL)! Verwenden Sie tatsächliche Finanzdaten, passen Sie Wachstumsprojektionen und -kosten an und beobachten Sie sofort, wie sich diese Veränderungen auf den inneren Wert von (DLGL) auswirken.
What You Will Receive
- Authentic Direct Line Data: Preloaded financial metrics – including revenue and EBIT – based on actual and forecasted figures.
- Comprehensive Customization: Modify all essential parameters (yellow cells) such as WACC, growth %, and tax rates.
- Instant Valuation Refresh: Automatic recalculations to assess the effects of changes on the fair value of Direct Line Insurance Group plc (DLGL).
- User-Friendly Excel Template: Designed for quick adjustments, scenario analysis, and extensive projections.
- Efficient and Precise: Eliminate the need to build models from the ground up while ensuring accuracy and adaptability.
Key Features
- Pre-Loaded Data: Direct Line Insurance Group plc's (DLGL) historical financial statements and pre-filled forecasts.
- Fully Adjustable Inputs: Modify WACC, tax rates, revenue growth, and EBITDA margins as needed.
- Instant Results: View the recalculated intrinsic value of Direct Line Insurance Group plc (DLGL) in real time.
- Clear Visual Outputs: Dashboard charts present valuation results and essential metrics clearly.
- Built for Accuracy: A reliable tool designed for analysts, investors, and finance professionals.
How It Works
- Download: Obtain the pre-built Excel file containing Direct Line Insurance Group plc's (DLGL) financial data.
- Customize: Tailor your forecasts, including projected growth rates, operating margins, and discount rates.
- Update Automatically: The intrinsic value and NPV calculations refresh in real-time.
- Test Scenarios: Generate various projections and instantly compare the results.
- Make Decisions: Utilize the valuation insights to inform your investment choices.
Why Opt for This Calculator?
- Precise Data: Trustworthy financial metrics from Direct Line Insurance Group plc (DLGL) provide dependable valuation results.
- Tailorable: Modify essential variables such as growth rates, WACC, and tax rates to align with your own forecasts.
- Efficient: Built-in calculations save you time, allowing you to avoid starting from the ground up.
- Professional-Quality Tool: Crafted for investors, analysts, and consultants alike.
- Easy to Use: An intuitive design and detailed step-by-step guidance ensure accessibility for all users.
Who Can Benefit from This Product?
- Insurance Professionals: Develop comprehensive and accurate valuation models for risk assessment and portfolio management.
- Corporate Finance Departments: Evaluate valuation scenarios to inform strategic decision-making.
- Consultants and Financial Advisors: Deliver precise valuation insights for Direct Line Insurance Group plc (DLGL) to clients.
- Students and Instructors: Utilize real-world data for hands-on practice and teaching in financial modeling.
- Insurance Industry Enthusiasts: Gain insights into how companies like Direct Line Insurance Group plc (DLGL) are valued in the insurance market.
What the Template Includes
- Pre-Filled DCF Model: Direct Line Insurance Group plc’s (DLGL) financial data ready for immediate utilization.
- WACC Calculator: Comprehensive calculations for the Weighted Average Cost of Capital.
- Financial Ratios: Analyze DLGL’s profitability, leverage, and operational efficiency.
- Editable Inputs: Modify assumptions such as growth rates, profit margins, and capital expenditures to tailor your scenarios.
- Financial Statements: Access annual and quarterly reports for thorough analysis.
- Interactive Dashboard: Effortlessly visualize key valuation metrics and outcomes.
Disclaimer
All information, articles, and product details provided on this website are for general informational and educational purposes only. We do not claim any ownership over, nor do we intend to infringe upon, any trademarks, copyrights, logos, brand names, or other intellectual property mentioned or depicted on this site. Such intellectual property remains the property of its respective owners, and any references here are made solely for identification or informational purposes, without implying any affiliation, endorsement, or partnership.
We make no representations or warranties, express or implied, regarding the accuracy, completeness, or suitability of any content or products presented. Nothing on this website should be construed as legal, tax, investment, financial, medical, or other professional advice. In addition, no part of this site—including articles or product references—constitutes a solicitation, recommendation, endorsement, advertisement, or offer to buy or sell any securities, franchises, or other financial instruments, particularly in jurisdictions where such activity would be unlawful.
All content is of a general nature and may not address the specific circumstances of any individual or entity. It is not a substitute for professional advice or services. Any actions you take based on the information provided here are strictly at your own risk. You accept full responsibility for any decisions or outcomes arising from your use of this website and agree to release us from any liability in connection with your use of, or reliance upon, the content or products found herein.