
|
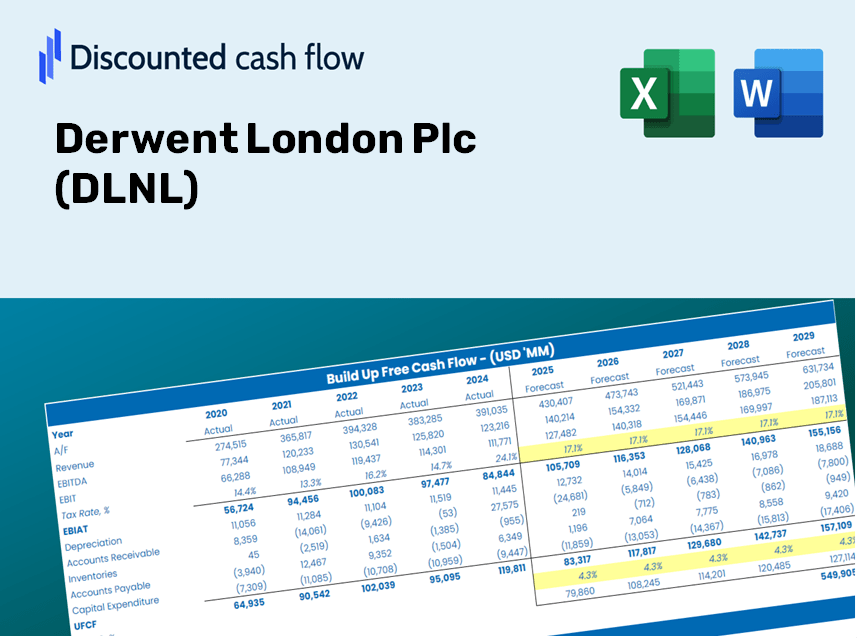
Derwent London Plc (DLN.L) DCF -Bewertung |
Fully Editable: Tailor To Your Needs In Excel Or Sheets
Professional Design: Trusted, Industry-Standard Templates
Investor-Approved Valuation Models
MAC/PC Compatible, Fully Unlocked
No Expertise Is Needed; Easy To Follow
Derwent London Plc (DLN.L) Bundle
Verbessern Sie Ihre Investitionsauswahl mit dem DCF -Taschenrechner von Derwent London Plc (DLNL)! Verwenden Sie tatsächliche Finanzdaten, passen Sie Wachstumsprojektionen und -kosten an und beobachten Sie sofort, wie sich diese Modifikationen auf den inneren Wert der Derwent London Plc (DLNL) auswirken.
What You Will Receive
- Customizable Excel Template: A fully editable Excel-based DCF Calculator featuring pre-loaded financial data for Derwent London Plc (DLNL).
- Authentic Data: Access to historical data and future projections (highlighted in the yellow cells).
- Flexible Forecasting: Adjust parameters such as revenue growth, EBITDA %, and WACC according to your needs.
- Instant Calculations: Quickly observe how your changes affect the valuation of Derwent London Plc (DLNL).
- Professional Resource: Designed for investors, CFOs, consultants, and financial analysts.
- Intuitive Layout: Organized for clarity and ease of navigation, complete with step-by-step guidance.
Key Features
- Authentic DLNL Data: Pre-populated with Derwent London's historical financial data and future projections.
- Flexible Input Options: Modify revenue growth rates, profit margins, WACC, tax percentages, and capital expenditure figures.
- Interactive Valuation Model: Automatically refreshes Net Present Value (NPV) and intrinsic value as per your input adjustments.
- Scenario Analysis: Develop various forecasting scenarios to explore different valuation possibilities.
- Intuitive User Experience: Designed for ease of use, accommodating both professionals and newcomers.
How It Works
- Step 1: Download the Excel file.
- Step 2: Review the pre-filled financial data and forecasts for Derwent London Plc (DLNL).
- Step 3: Adjust key inputs such as revenue growth, WACC, and tax rates (highlighted cells).
- Step 4: Observe the DCF model update in real-time as you modify your assumptions.
- Step 5: Evaluate the outputs and leverage the results for your investment strategies.
Why Opt for This Calculator?
- All-in-One Solution: Combines DCF, WACC, and comprehensive financial ratio analyses into a single tool.
- Adjustable Parameters: Modify the yellow-highlighted cells to explore different scenarios.
- In-Depth Analysis: Automatically computes the intrinsic value and Net Present Value for Derwent London Plc (DLNL).
- Data Rich: Features historical and projected data to provide reliable starting points.
- Top-Tier Quality: Perfect for financial analysts, investors, and business consultants alike.
Who Should Use This Product?
- Individual Investors: Make informed decisions about buying or selling Derwent London Plc (DLNL) stock.
- Financial Analysts: Enhance valuation processes with readily available financial models for Derwent London Plc (DLNL).
- Consultants: Provide clients with accurate and professional valuation insights related to Derwent London Plc (DLNL).
- Business Owners: Gain insights into how large real estate companies like Derwent London Plc (DLNL) are valued to inform your own business strategy.
- Finance Students: Explore valuation methods using real-world data and case studies from Derwent London Plc (DLNL).
What the Template Includes
- Pre-Filled DCF Model: Derwent London Plc’s (DLNL) financial data preloaded for immediate analysis.
- WACC Calculator: Comprehensive calculations for the Weighted Average Cost of Capital.
- Financial Ratios: Assess Derwent London Plc’s (DLNL) profitability, leverage, and operational efficiency.
- Editable Inputs: Modify assumptions such as growth rates, profit margins, and CAPEX to suit your analysis.
- Financial Statements: Annual and quarterly reports for in-depth evaluation.
- Interactive Dashboard: Effortlessly visualize crucial valuation metrics and outcomes.
Disclaimer
All information, articles, and product details provided on this website are for general informational and educational purposes only. We do not claim any ownership over, nor do we intend to infringe upon, any trademarks, copyrights, logos, brand names, or other intellectual property mentioned or depicted on this site. Such intellectual property remains the property of its respective owners, and any references here are made solely for identification or informational purposes, without implying any affiliation, endorsement, or partnership.
We make no representations or warranties, express or implied, regarding the accuracy, completeness, or suitability of any content or products presented. Nothing on this website should be construed as legal, tax, investment, financial, medical, or other professional advice. In addition, no part of this site—including articles or product references—constitutes a solicitation, recommendation, endorsement, advertisement, or offer to buy or sell any securities, franchises, or other financial instruments, particularly in jurisdictions where such activity would be unlawful.
All content is of a general nature and may not address the specific circumstances of any individual or entity. It is not a substitute for professional advice or services. Any actions you take based on the information provided here are strictly at your own risk. You accept full responsibility for any decisions or outcomes arising from your use of this website and agree to release us from any liability in connection with your use of, or reliance upon, the content or products found herein.